


INTRODUCTION
The current guidelines for sepsis and septic shock treatment recommend fluid resuscitation to treat sepsis induced hypoperfusion [1-4]. Although this fluid resuscitation strategy, well adopted in clinical practice, presumes dehydration in sepsis patients, pretreatment body water status in patients with sepsis has not previously been properly assessed [5-7]. Moreover, recent clinical reports suggest that aggressive and indiscriminative fluid resuscitation strategies without precise identification of water status in patients are likely to worsen vasodilatory shock and increase capillary leaks and tissue edema, which can lead to an increased risk of death [8-10]. Little is known about how body water percentage changes when transitioning from a healthy state to either non-septic infection or a septic condition, and it is unclear whether patients with sepsis can be presumed to be dehydrated [11-13]. Therefore, comparison of body water status in patients with non-septic infection and patients with sepsis with that in healthy individuals might help us understand the pathophysiology of the shift in body water status during the progression of sepsis [5,14,15].
Using bioelectrical impedance analysis (BIA), a previous study has demonstrated that fluid resuscitation increased the proportion of extracellular water (ECW) to total body water (TBW) in a non-survivor group of patients with sepsis compared to the survivor group [16]. Although the longitudinal trend of body water, including ECW/TBW, during fluid resuscitation was adequately addressed in the study, no direct comparison of body water status between patients with sepsis and healthy individuals has been conducted. It is not well understood in which water compartments body water actually alters when a previously healthy individual is diagnosed with sepsis. Due to the absence of a reference value, there has been limited use of body water status as a diagnostic parameter in patients with suspected infection including sepsis. If this alteration could be demonstrated using indices acquired from BIA, these indices would be of diagnostic value in identifying body water status as well as fluid treatment requirements in patients with sepsis.
Therefore, this study was designed to use BIA to investigate the alteration of body water status in patients with sepsis compared to healthy individuals. In addition, patients with non-septic infection were compared to the healthy population to determine how the body water profile is modified in non-septic infection and how these changes differ from those in patients with sepsis. Including patients with non-septic infection who do not require fluid resuscitation meant that diagnostic variables for fluid treatment could be evaluated.
METHODS
Study settings and design
Two groups of patients whose primary presentation to the emergency department (ED) was either sepsis or non-septic infection were enrolled prospectively from a single ED in a university affiliated hospital between January 2018 and December 2019. The third group of healthy controls who underwent routine or customized health checkups at a health promotion center in the same institute was recruited retrospectively between January 2018 and December 2018.
To prevent fluid treatment before patient enrollment, patients were enrolled after initial vital signs assessment and the first medical examination by a physician before acquiring other laboratory values or treatment. Patients in the sepsis group were those presumed to have infection with a shock feature (defined as systolic blood pressure Ōēż90 mmHg) necessitating fluid therapy. Patients in the non-septic infection group were those with probable infection according to initial vital signs and first medical examination but who did not show shock or organ failure features requiring fluid treatment [17]. These two groups of patients were then compared to sex-, age- (┬▒1 year), and height- (┬▒2 cm) matched healthy controls in a 1:3 ratio [18,19]. Patients who were aged <18 years, had end-stage renal disease with renal replacement therapy, presented with overt heart failure, had a pacemaker or an implantable cardioverter defibrillator, or had received any fluid therapy intravenously prior to enrollment were excluded from the sepsis and non-septic infection groups. Patients transferred from lower level hospitals were not excluded on that basis as long as they did not have intravenous fluid therapy prior to ED arrival. Prior fluid administration was confirmed by either the patient or the guardian. Written informed consent was obtained from all patients or their legal guardians before enrollment in the study. Retrospective data acquisition from healthy controls was approved by the health promotion center. All study procedures were performed in accordance with the relevant guidelines and regulations. The study was approved by the institutional review board of Seoul National University Bundang Hospital (B-1911/577-305).
Measurement of clinical variables
Data related to baseline demographics, including age, sex, and underlying diseases, such as diabetes mellitus, hypertension, chronic liver disease, chronic lung disease, and chronic kidney disease, were collected for patient and healthy groups. Height (cm) and weight (kg) data required in BIA measurements were acquired before fluid treatment for the non-septic and sepsis patient groups. If weight measurement was not feasible due to the patientŌĆÖs bedridden status or very unstable vital signs, data were acquired from previous electronic medical records or information from either the patient or the guardian. For patients in the sepsis and non-septic infection groups, initial vital signs, including systolic blood pressure, diastolic blood pressure, mean arterial pressure, heart rate, respiratory rate, and body temperature, were measured. Source of infection was assessed by retrospectively reviewing medical records or based on discharge diagnosis provided by the attending physician. Laboratory values, including complete blood counts and total bilirubin, blood urea nitrogen, creatinine, albumin, sodium, potassium, calcium, phosphorus, glucose, uric acid, and C-reactive protein levels, were obtained from electronic medical records.
BIA
InBody S10 and 770 (InBody Co., Seoul, Korea) devices were used to analyze body water status in patients recruited in the ED and healthy controls, respectively. Eight electrodes, two electrodes for each of the four extremities, were attached to the individuals in the supine position. Thirty impedance variables using six different frequencies (1, 5, 50, 250, 500, and 1,000 kHz) at each of the five parts of the body (the right arm, left arm, trunk, right leg, and left leg) and 15 reactance (Xc) and phase angle (╬Ė) variables using three different frequencies (5, 50, and 250 kHz) at each of the five parts of the body were measured. Phase angle, a well-known parameter in previous BIA studies, was also investigated to compare with other variables [20-22]. TBW, intracellular water (ICW), and ECW were estimated using the differences in electrical conductance measured by the devices. All BIA measurements were performed before fluid resuscitation to reflect the pretreatment body water status.
Statistical analysis
For sample size determination, the matching of 1:n ratio of patients to controls were conducted; although a healthy population of 11,190 were recruited, only up to 1:3 ratio of patients to controls was feasible due to the extremely old population in the group of sepsis patients. Continuous variables are presented as mean┬▒standard deviation and categorical variables are presented as numbers (%). Analysis of variance with a post-hoc Tukey multiple comparisons test was conducted to determine the differences between the healthy, non-septic, and sepsis groups. Student t-test was used to determine P-values, and P<0.05 was considered statistically significant. Statistical analyses were conducted using STATA/SE ver. 15.0 (StataCorp LP, College Station, TX, USA) and Prism ver. 8.0 (GraphPad Software, San Diego, CA, USA).
RESULTS
Study population and baseline characteristics
Eighty-seven patients with non-septic infection and 54 patients with sepsis were prospectively enrolled during the study period. The retrospectively recruited control population included 11,190 healthy individuals. The baseline characteristics of all three groups are shown in Table 1. Age, height, and weight were significantly different across the three groups; more details of these differences and their significance are shown in Supplementary Fig. 1. The proportions of underlying diseases also varied significantly among the groups, with the sepsis group having the highest proportion of underlying co-morbidities. Initial vital signs were also significantly different between the non-septic infection and sepsis groups, whereas the sites of infection were distributed in a similar pattern in both groups of patients. Among laboratory findings, white blood cell counts did not vary significantly, whereas hemoglobin and platelet counts were significantly decreased in the sepsis group. Total bilirubin, blood urea nitrogen, creatinine, uric acid, and C-reactive protein were significantly higher in the sepsis group, while albumin and calcium levels were significantly lower.
Body water status in patients with sepsis and those with non-septic infection compared to healthy controls
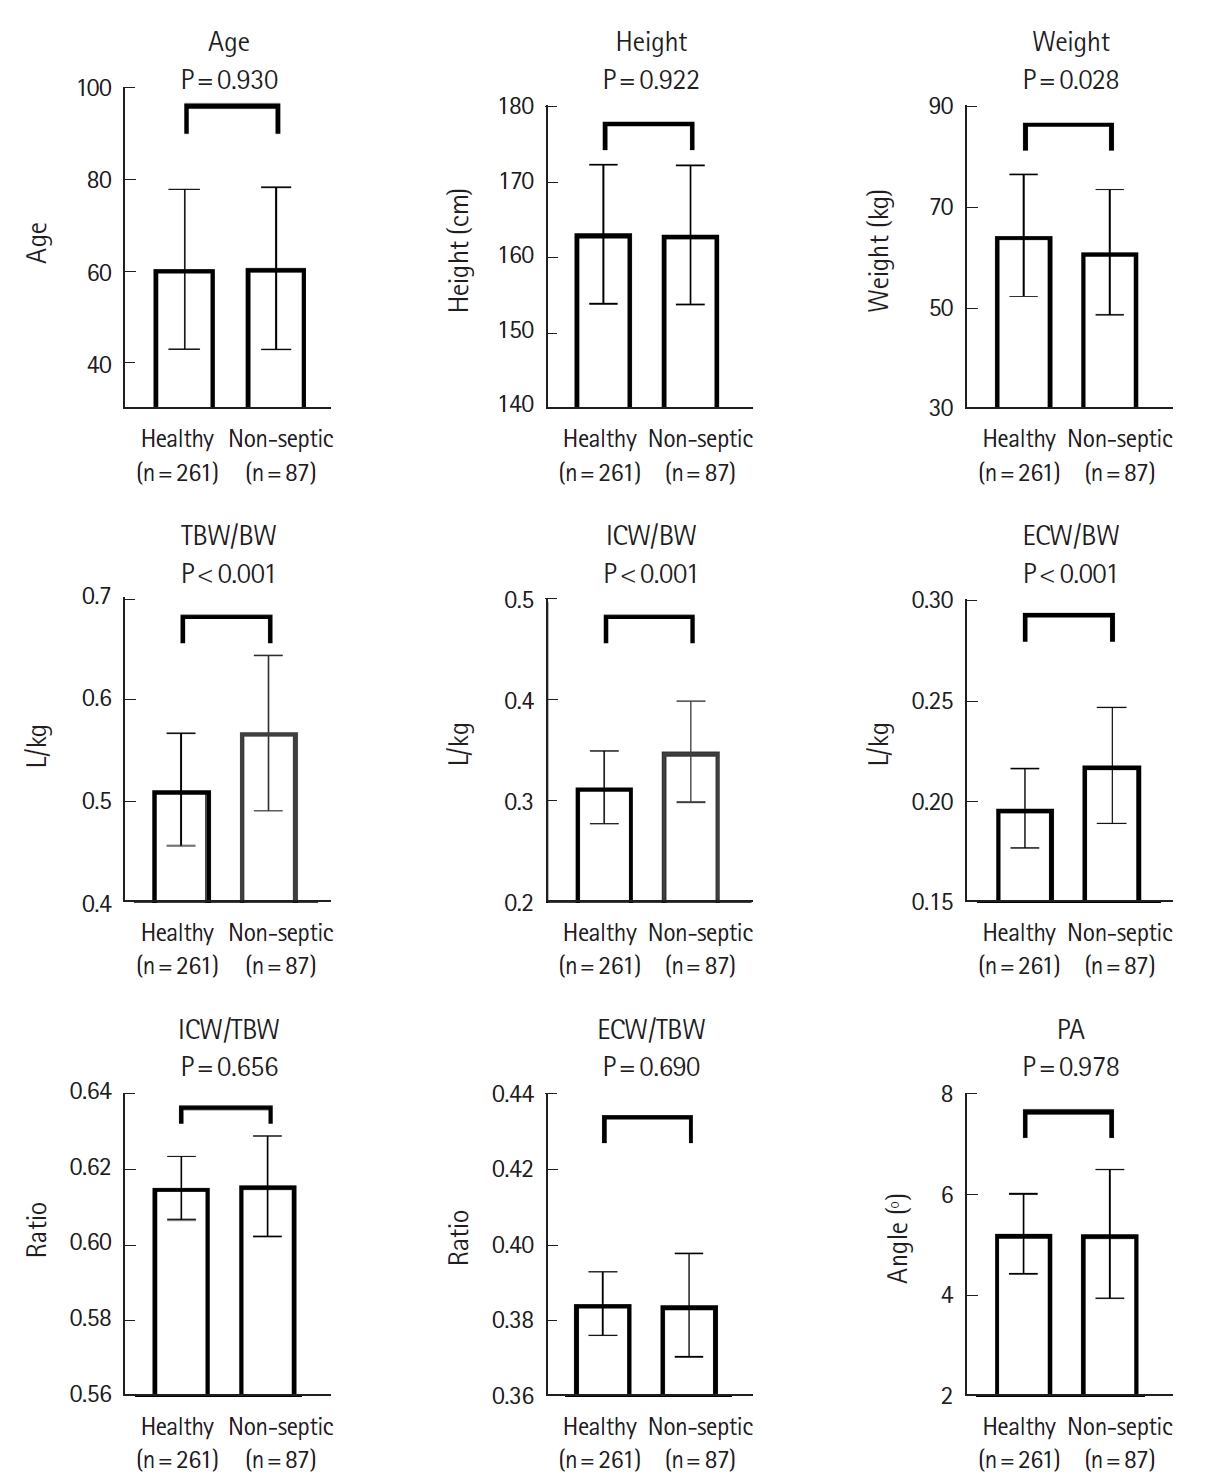
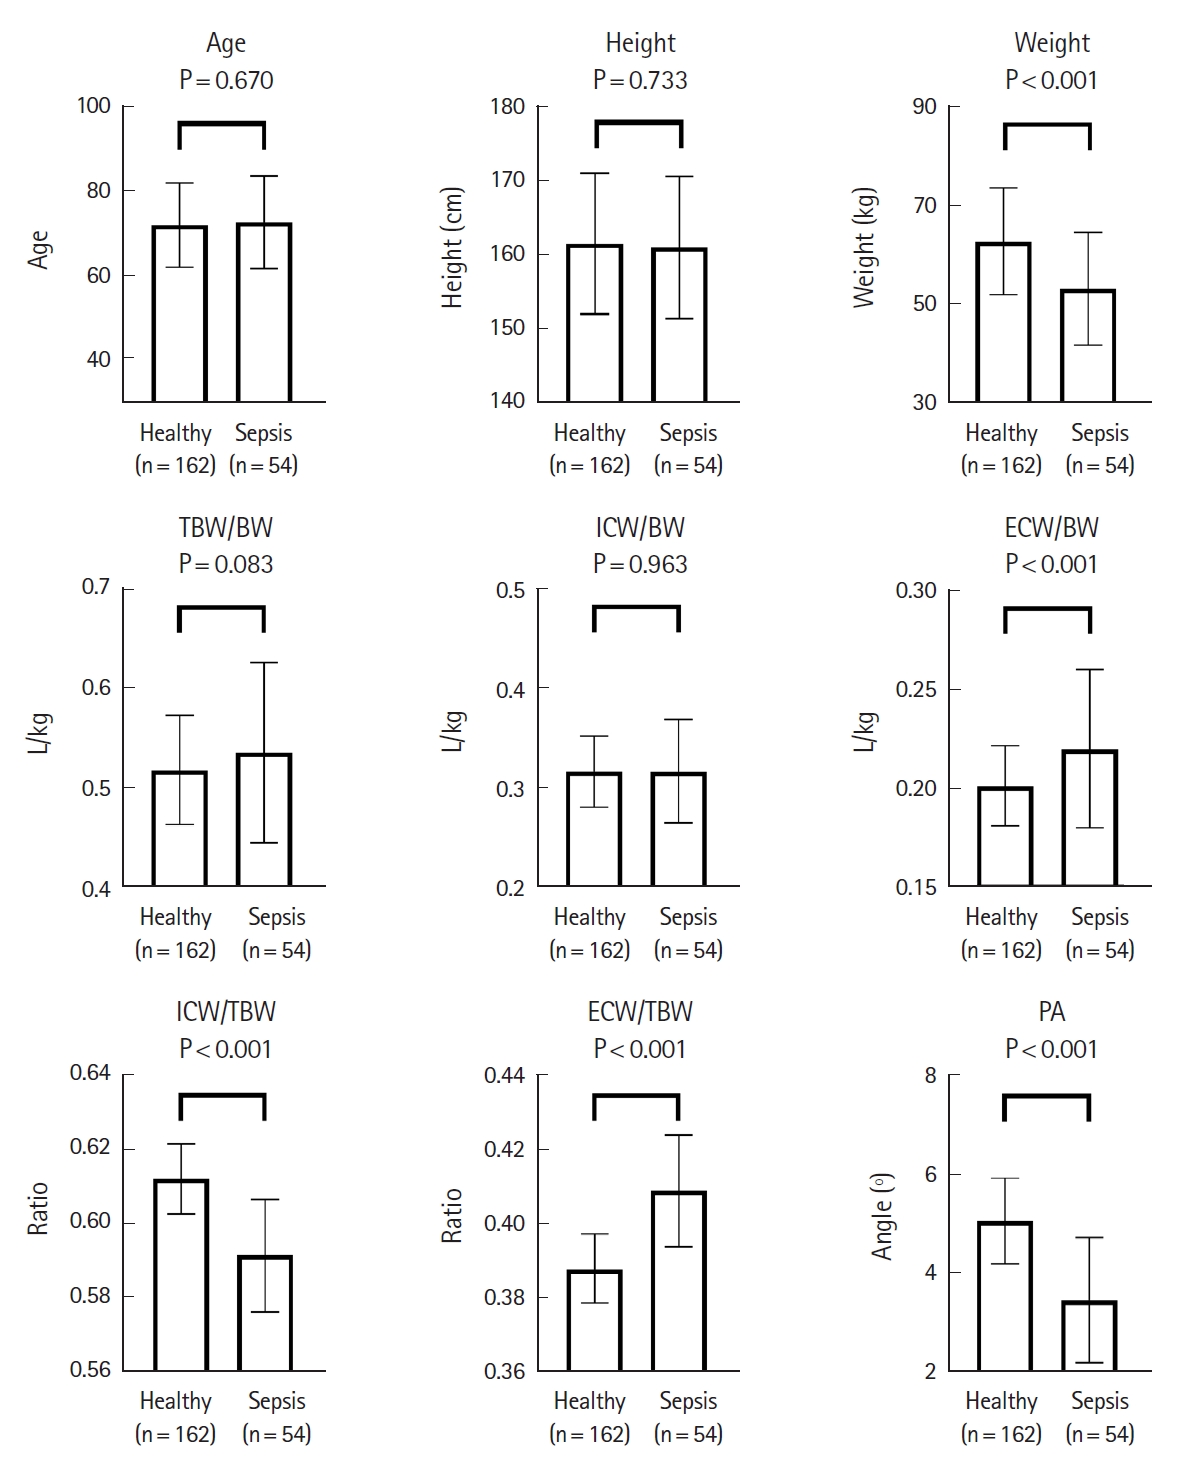
The TBW, ICW, and ECW values obtained from BIA were standardized by body weight (BW) and expressed as TBW/BW, ICW/BW, and ECW/BW. In addition, the ratio of ICW to TBW (ICW/TBW) and the ratio of ECW to TBW (ECW/TBW) were calculated to compare the distribution of body water. Apart from body water profiles, phase angles, which were automatically calculated by the BIA device and reflected the ratio of body cell mass to fat free mass, were compared (Supplementary Fig. 1). The resulting bar plots show distinct differences between the proportions of indices obtained from BIA. To control for confounding factors in baseline characteristics, patients with non-septic infection and healthy controls (Fig. 1) and patients with sepsis and healthy controls (Fig. 2) were sex-, age- (┬▒1 year), and height-matched (┬▒2 cm) in a 1:3 ratio.
The resulting data from the matching process are shown in Figs. 1 and 2. TBW/BW (P<0.001), ICW/BW (P<0.001), and ECW/BW (P<0.001) were significantly increased in the non-septic infection group compared with the healthy group; however, there were no significant differences in ICW/TBW or ECW/TBW and phase angles.
Fig. 2 shows the differences in values between the sepsis and healthy groups. Unlike when comparing the non-septic infection and healthy groups, TBW/BW and ICW/BW were not significantly decreased in the sepsis group compared with the healthy group, while the ECW/TBW increased significantly (P<0.001) in the sepsis group. ICW/TBW (P<0.001) and phase angles (P<0.001) were also significantly lower in the sepsis group.
DISCUSSION
This study demonstrated body water profile using TBW, ICW, and ECW values obtained using BIA. The distribution of body water in patients with non-septic infection and those with sepsis was significantly different from healthy controls. To exclude confounding factors, such as sex, age, and height, retrospective control data from a health promotion center were used, and three healthy controls were sex-, age-, and height-matched to each patient diagnosed with non-septic infection or sepsis [18,19]. Compared to the healthy population, TBW, including ECW and ICW, was significantly increased in patients with non-septic infection, while TBW was not decreased in patients with sepsis. In contrast, the ECW/TBW, which indicates extracellular edema and intracellular dehydration, was significantly higher in patients with sepsis, whereas no difference was identified between the non-septic infection and healthy groups.
BIA is of interest as a clinical tool in the assessment of volume status because it is an inexpensive, quick, and non-invasive measuring tool, as well as an accessible one [23-25]. BIA allows for vector analysis, phase angle derivation, and direct segmental multi-frequency BIA specifically measures TBW, as well as ICW and ECW water content, which provides insight into the destination of administered fluids [26-28]. However, despite the increasing popularity of BIA in clinical practice, previous studies of BIA in sepsis patients provide only limited evidence for the variable having diagnostic value, because of the lack of comparisons with the healthy population. As BIA measurements are strongly influenced by sex, age, and height, comparisons might be acceptable if these factors were matched [29]. One strength of our study is that these matching comparisons were performed, thus minimizing confounding bias. In addition, as we have previously demonstrated, fluid treatment alters the body water status, which suggests that measurement of BIA could be conducted before the initiation of fluid administration to accurately calculate body water status in an unbiased manner [16,23].
Previous studies have assessed the feasibility and analyzed the volume status of sepsis patients using BIA. In a single intensive care unit study, patients with peritonitis and sepsis had higher ECW components than those with blunt trauma, although changes in TBW were similar [12]. In another study using continuous renal replacement therapy to correct volume excess in septic shock patients with acute renal failure, there was an increase in TBW, ECW, and ECW/ICW in non-survivors [30]. A third study comparing intensive care unit patients with sepsis to those without sepsis showed that ECW and fat free mass hydration were increased in severe sepsis compared to sepsis [31]. However, even though the increase in ECW was similar to our studyŌĆÖs finding, the above-mentioned studies were limited in their ability to suggest that ECW variables have initial diagnostic value, because direct comparisons with healthy volunteers were absent.
Our results, showing a significant increase in ECW/TBW ratio but no significant increase in TBW/BW ratio in the sepsis group may be explained by the hypothesis that a systemic inflammatory response with oxidative stress and production of reactive oxygen species is associated with damage to cell membranes and loss of cell wall integrity that results in capillary leakage and interstitial edema [32-34]. In addition, patients with sepsis are prone to the distribution of fluid from the intravascular to the extravascular space, which does not respond to the usual massive fluid treatment strategy [35]. Therefore, we suggest that the ECW/TBW ratio may in the future be used as a diagnostic tool to assess sepsis-related capillary leakage syndrome [16,36]. An increasing ECW/TBW can be a detrimental sign for fluid treatment in sepsis, and based on this hypothesis we are currently planning a further clinical trial investigating the ECW/TBW index as a monitoring parameter for fluid treatment [16]. Besides this, additional future studies are necessary to investigate ways of improving cellular and vascular integrity [33,37].
Phase angle is a significant predictor of survival in not only sepsis but also various other diseases, according to previous BIA studies [38-40]. It is regarded as a biomarker of cellular health, as it is correlated with cell mass, the integrity of cell membranes, and hydration profile [24,41]. In our study, a significant difference in phase angle was also identified between the healthy controls and patients with sepsis, as well as the significant difference in ECW/TBW. However, as shown in the previous study, a longitudinal trend of phase angle failed to differentiate between survivors and non-survivors of sepsis, thus its value as a monitoring marker in fluid treatment is limited [16].
Interestingly, compared to the matched healthy subjects, patients with non-septic infection presented with significantly increased TBW/BW, ICW/BW, and ECW/BW. In contrast, the proportions of ICW and ECW to TBW were not significantly different, suggesting fluid retention without an alteration of body water distribution in patients with non-septic infection. The reason for this phenomenon is not completely understood and a possible explanation could be that in certain acute infections, pro-inflammatory cytokines induced by inflammation increase the release of arginine vasopressin in the posterior pituitary gland [42]. Further research addressing water retention caused by antidiuretic hormone elevation in infectious diseases may be warranted [43-45].
This study has several limitations. First, the study was limited to a small number of patients and healthy subjects of a single ethnicity and in a single tertiary center. Future multicenter studies or studies including individuals of other ethnicities might be needed for greater generalizability. Second, we could match and compare the healthy group with the non-septic infection group and the healthy group with the sepsis group, but we could not directly compare the non-septic infection and sepsis groups because of the significantly different age ranges of individuals in those two groups (Table 1). Third, we could not control each personŌĆÖs intake of water before enrollment into the study due to the characteristics of the study. Bias from the water deprivation of healthy controls, due to work-ups at the health promotion center, or poor oral intake of sepsis patients cannot be fully excluded. We did, however, conduct a chart review of healthy controls to exclude those who had a bowel preparation before colonoscopy. Fourth, although we excluded patients with an underlying volume overload condition such as heart failure or with end-stage renal disease to minimize the possible influence on the body water measurements, we did not include other conditions such as lymphedema in our exclusion criteria. Fortunately, on retrospective review, we found that none of the included patients in either the sepsis or non-septic infection group was previously diagnosed with lymphedema. Fifth, although previous studies have utilized direct segmental multi-frequency BIA of a specific instrument (InBody S10 and InBody 770), BIA is not fully validated for body water measurement in patients with sepsis [16,38,46]. As BIA might not be the gold standard for determining body water, further external validation in different clinical conditions or direct comparison with the water dilution method might be needed [12]. Finally, measurement of BW, which was utilized as a standardization variable for body water, was not feasible in some patients with sepsis due to their very unstable clinical condition or requirement of in-bed measurements in crowded ED situations. In those patients, or in cases where guardians could not accurately remember the BW, BW variables might have been inaccurate.
In summary, compared to the healthy group, the ratio of body water to BW was significantly increased in the non-septic infection group, while ECW/BW and ECW/TBW were significantly increased in the sepsis group. Instead of body water decrease, modification of body water distribution to the extracellular portion might be a potential diagnostic variable to body water deficit in patients with sepsis.