


INTRODUCTION
The injury-related disease burden in South Korea is relatively high compared to that in other nations. When disability adjusted life year was calculated by injury mechanism, the number of falls in South Korea was 250,600 per year in 2012, placing it at 28th among 188 nations who joined the World Health Organization, while that of traffic-related injury was 332,300 per year, ranking South Korea at the 43rd place [1]. Thirty percent of Korea’s burden of economic cost in 2006 was due to traffic-related injuries [2].
Injury is a major cause of death in South Korea. The number of deaths due to injury in 2012 was 12.9 per 100,000 persons, of which 6.15% were due to unintentional injuries. Unintentional injury is the second leading cause of deaths in people aged 0 to 9 years old, teens, and people in their twenties; it is the third leading cause of deaths in people in their thirties; it is a high-ranked cause of death especially in younger people.
Since some unintentional injuries are preventable, the term “accident” is not appropriate [3]. For any injury prevention intervention to be effectively carried out, it is important that the program be designed to meet the demands of each group within the population [4]. Therefore, while identifying the scale and causes of injury for the entire population, the information on the detailed injury characteristics in each group, such as sex and age must be collected.
The injury pyramid, which is based on the occupational injury prevention research of Heinrich in 1930, schematically shows the relative influence of fatal and nonfatal injuries [5]. Death by injury occupies the top of the pyramid, followed by hospitalization and emergency room visit. Because the injury pyramid has an advantage of easily showing the general status depending on severity, it was used to explain injury in both the population and a specific group [6,7].
This study was conducted to help in developing an effective injury prevention and trauma care program by identifying the scales and causes of injury incidences in Korea based on severity, using the injury pyramid and by analyzing the sex- and age-dependent differences and the basic demographic characteristics.
METHODS
This is a cross-sectional study estimating the incidence scale of unintentional injuries for each group based on severity after classifying it into death, hospitalization, and outpatient care due to injury. This study was approved by the research ethics review committee of Ajou University Hospital (AJIRB-SBR-EXP-13-212).
In this study, the injury pyramid was calculated using the officially available data by classifying injury outcomes into deaths, hospitalizations, and outpatient visits. The 2011 death certification data were used for estimating deaths by injury [8]. It is required by law that the death report must be confirmed and entered into the population dynamics system within 1 month of death after the family of the deceased submits the death report and death certificate written by a doctor to the administrative office. The survey participants are South Koreans residing in the South Korean territory, including natural and naturalized citizens. The National Information Society Agency reviews the corresponding contents, classifies them by cause of death according to the Korean Standard Classification of Diseases (KCD) version 6 [9], and publishes the raw data in an Excel file. In this study, 16,103 persons were considered to have died because of injuries as their causes of death were recorded as violent.
The rate of hospitalization caused by injury was calculated using the 2010 Korean National Hospital Discharge In-depth Injury Survey [10]. This survey is conducted annually by extracting data from 170 medical institutions nationwide. The stratified 2-stage sample extraction method used takes the number of beds and the regions into consideration. Of the total patients discharged annually from the 170 sampled medical institutions, the medical records of 9% of the patients were used. The cause of hospitalization was classified according to KCD version 5. In this study, 23,536 cases recorded with the KCD V01-X59 code were considered to be injury-related hospitalizations.
The 2011 Korea National Health and Nutrition Examination Survey (KNHNE) was used for injury-related outpatient cases [11]. This survey used a nationally representative sample and looked into the chronic disease status, health-related awareness and behaviors, food and nutrition intake status, and injury status. From January to December 2011, all family members older than 1 year were surveyed in 3,840 households across the nation. The sample households were extracted by the stratified 2-stage sampling method, and the 20 final survey subject households were extracted by performing systematic sampling. In this survey, the injury-related outpatient group consisted of 556 people who answered “yes” to the question “Did you experience accidents or poisoning that required treatment at a hospital or emergency room in the past 1 year?”
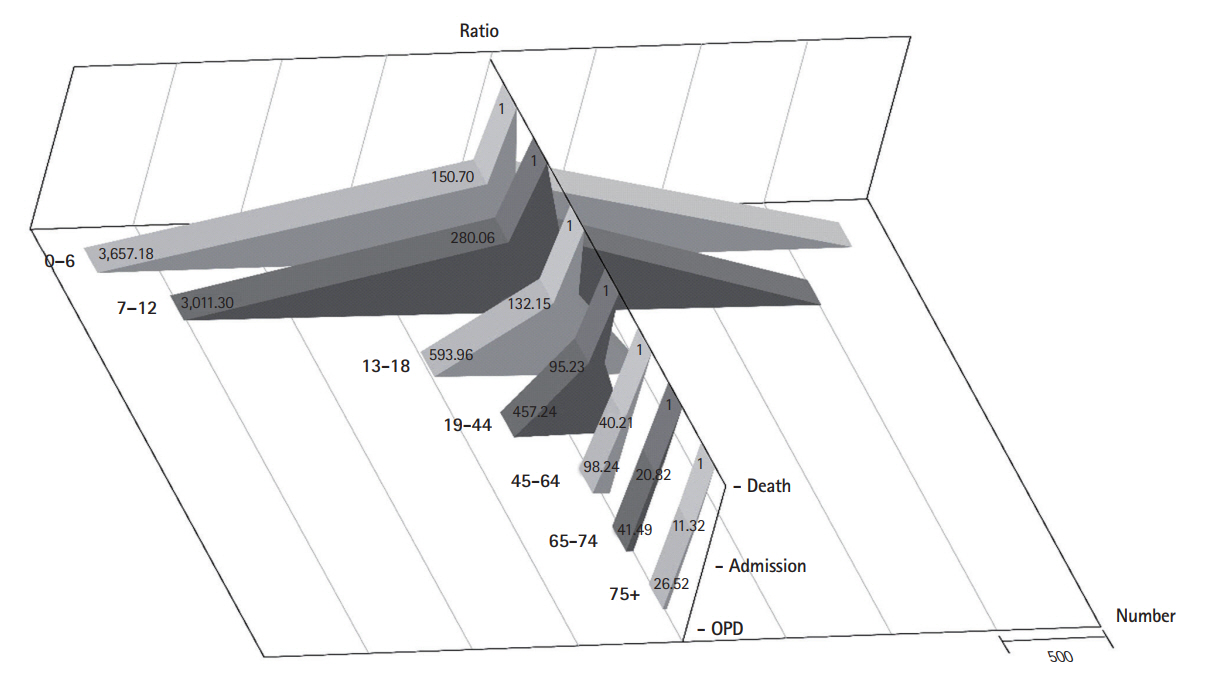
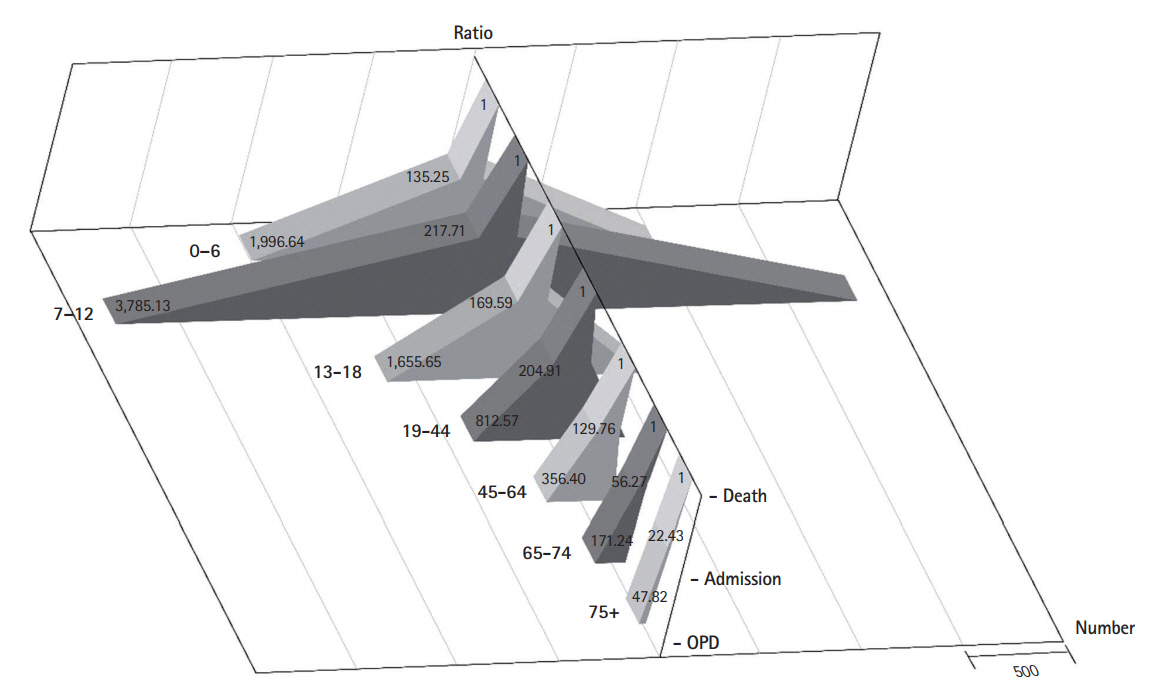
In order to analyze the injury pyramid, participants were divided into seven age groups: 0 to 6, 7 to 12, 13 to 18, 19 to 44, 45 to 64, 65 to 74, and over 75 years old. This classification factored in the South Korean school system and the aging of the South Korean population.
In addition to sex and age, the analysis was conducted on the injury mechanism. Since different injury mechanism classifications were used by the data sources of deaths, hospitalizations, and outpatient visits, the analysis focused on the injury mechanisms of the major causes of death among South Koreans, which can be applied generally. These were divided into traffic-related injury, fall-related injury, fire/burn injury, poisoning, and others.
In this study, we calculated the number of deaths, hospitalizations, and outpatients as well as the mortality, hospitalization, and outpatient department (OPD) visit rates per 100,000 persons. These rates were calculated by dividing the number of deaths, hospitalizations, or outpatient cases with the annual estimated population of the corresponding data. In addition, dividing the number of hospitalized patients and outpatient cases by the respective number of dead, the ratio of hospitalized patient to outpatient cases with respect to the dead was obtained. Based on this, the respective hospitalized patient and outpatient case numbers per 1 dead in 100,000 persons were estimated.
The National Hospital Discharge In-depth Injury Survey and the National Health and Nutrition Survey are sample surveys, while the mortality data of Statistics Korea (National Statistics Office) is a census. Therefore, the National Hospital Discharge In-depth Injury Survey and the National Health and Nutrition Survey were adjusted to the scale equal to the death data of Statistics Korea after applying weight by conducting a complex sample design that employs the stratified 2-stage sampling. The frequencies of the mortality, hospitalization, and OPD visit rates and the ratios of death to hospitalization and death to outpatient visit ratios were analyzed according to sex, age, and injury mechanism; after separating males and females, the mortality, hospitalization, and OPD visit rates were analyzed based on age and injury mechanism. Statistical analysis was performed using IBM SPSS Statistics ver. 20.0 (IBM Corp., Armonk, NY, USA). The data were tested for normality. Comparisons with continuous data were made using the t-test. Categorical data were analyzed using chi-square tests. A 5% significance level (two-tailed) was used for all analyses.
RESULTS
Scale of unintentional injury according to age and sex
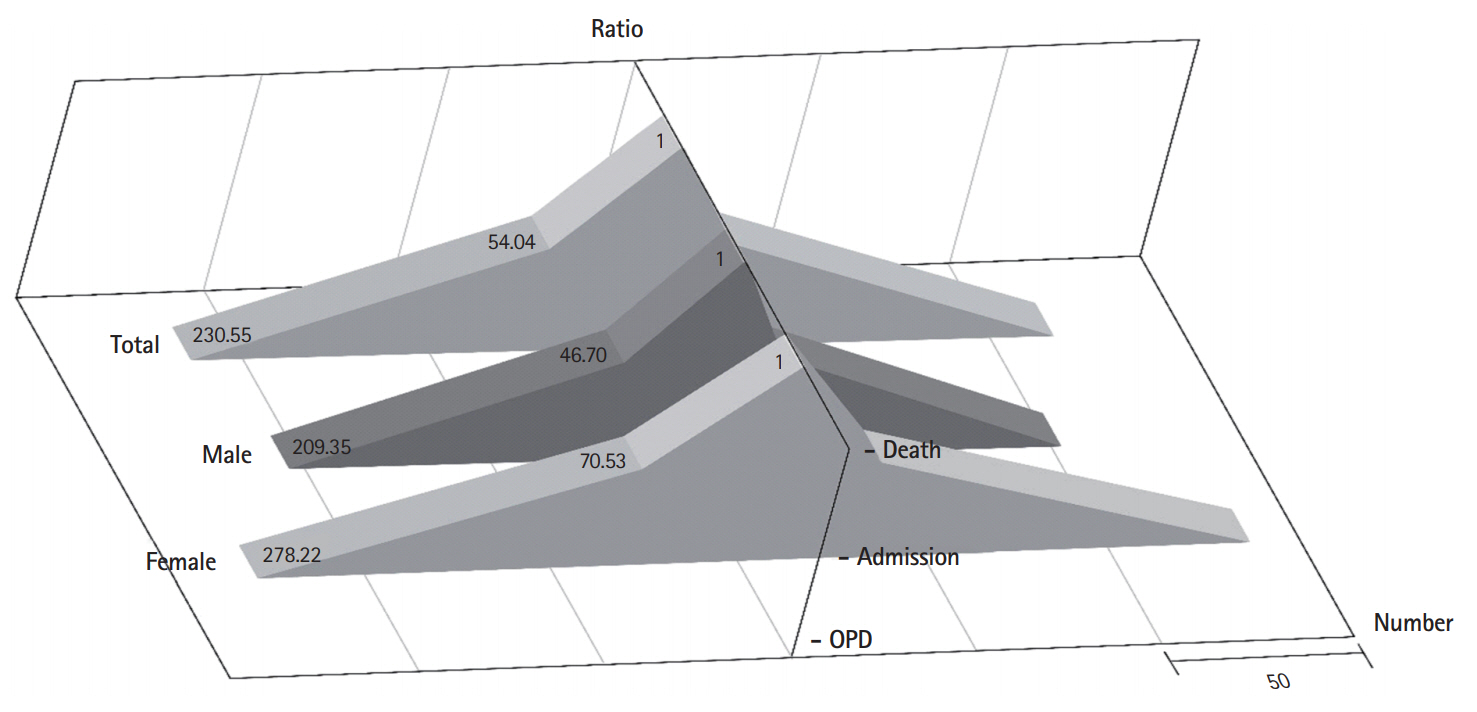
The total incidence of unintentional injury included 31.74 deaths, 1,715.27 hospitalizations, and 7,317.55 outpatient cases per 100,000 persons. For 100,000 males, there were 43.87 deaths, 2,048.85 hospitalizations, and 9,184.40 outpatient cases. For 100,000 females, there were 19.57 deaths, 1,380.29 hospitalizations, and 5,444.83 outpatient cases. The injury incidence was higher in males than in females, and there were more hospitalizations and OPD visits than deaths among females. The mortality and hospitalization rates due to injury per 100,000 persons were the highest among those over 75 years old, and the OPD visit rate was the highest among preschool children aged 0 to 6 years (Table 1 and Figs. 1-3).
The ratio of death:hospitalization:outpatient was 1:46.70:209.35 when the mortality rate was adjusted to one. Males over 75 years old had the highest mortality and hospitalization rates per 100,000 persons due to injury among all males, while OPD visit rate was the highest among male preschool children of 0 to 6 years old (Table 1 and Figs. 1-3). The ratio of death:hospitalization:outpatient was 1:70.53:278.22 when the mortality rate was adjusted to one. For females, similar to males, the age group with the highest injury-related mortality and hospitalization rates per 100,000 persons was the group over 75 years old while OPD visit rate was the highest among the 0- to 6-year-old female preschool children (Table 1 and Figs. 1-3).
Scale of unintentional injury according to injury mechanism
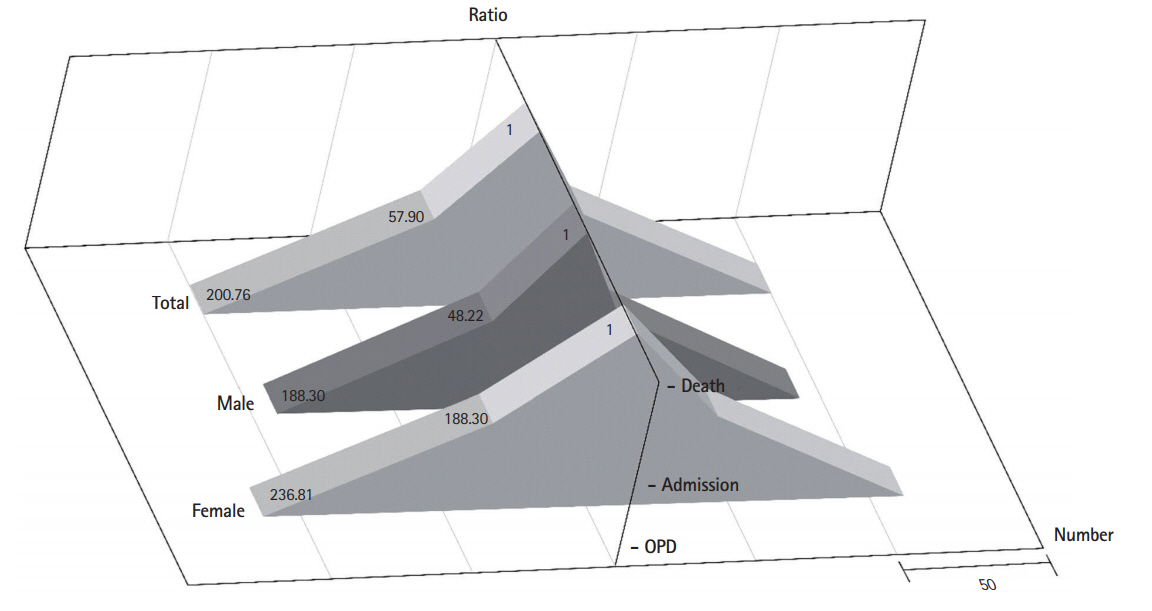
The injury mechanism that caused most deaths, hospitalizations, and OPD visits in South Korea was traffic-related injury. The mortality due to traffic-related injury per 100,000 persons was 12.53, hospitalization rate was 725.50, and OPD visit rate was 2,515.47; the ratio was 1:57.90:200.76. Mortality due to fall-related injury per 100,000 persons was 4.59, hospitalization rate was 541.72, and OPD visit rate was 2,174.46; the ratio was 1:118.02:473.74. The injury incidence rate due to poisoning and burn/fire was somewhat lower than that of due to traffic-related or fall-related injuries. The mortality rate by poisoning was higher than that of injury by burn/fire, while the hospitalization and outpatient rates of burn/fire injuries were higher.
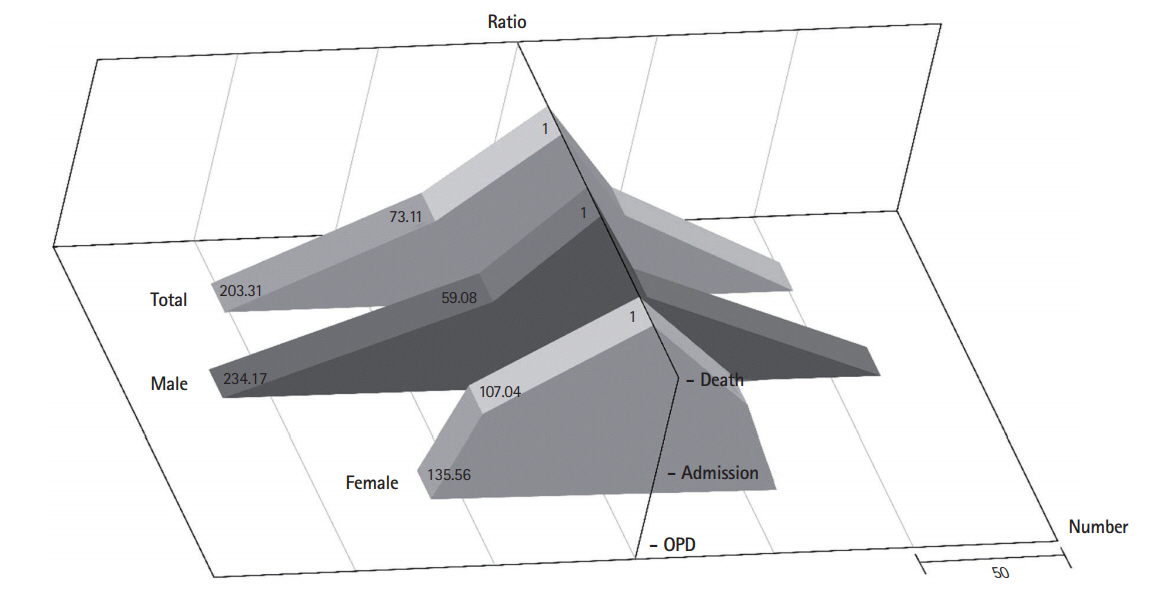
For males, rates of mortality, hospitalization, and OPD visits due to traffic-related injury per 100,000 persons were higher than those of other injury mechanisms. The mortality rate due to traffic-related injury per 100,000 persons was 18.54, the hospitalization rate was 894.06, and the OPD visit rate was 3,491.01; the ratio was 1:48.22:188.30. The mortality rate due to fall-related injuries per 100,000 persons was 6.87, the hospitalization rate was 550.44, and the OPD visit rate was 2,406.07; the ratio was 1:80.12:350.23. The ratio was 1:59.08:234.17 if the mortality rate due to burn/fire injury was one, and 1:18.08:30.96 was the ratio for poisoning. For females, rates of mortality, hospitalization, and the OPD visits per 100,000 persons were higher for traffic-related and fall-related injuries than those for other injury mechanisms. Of those, the mortality and hospitalization rates were the highest OPDin the cases of mortality and hospitalization, while the OPD visit rate was the highest in the case of OPD visits.
The rate of mortality due to traffic-related injury per 100,000 persons was 6.49, the hospitalization rate was 556.24, and the OPD visit rate was 1,536.87; the ratio was 1:85.71:236.81. The mortality rate due to fall-related injuries per 100,000 persons was 2.3, the hospitalization rate was 532.96, and the OPD visit rate was 1,942.13; the ratio was 1:231.72:844.40. The mortality rate due to burn/fire was 1.07 per 100,000 persons, the hospitalization rate was 23.17, and the OPD visit rate was 54.31; the ratio was 1:21.65:50.76 (Table 2 and Figs. 4-7). The differences according to sex and age amongst injury mechanisms were statistically significant (P<0.001) (Table 3).
DISCUSSION
This study is significant in that it estimated the national injury scale by combining the data currently under survey, and it attempted to estimate the scale of unintentional injury based on the cause of death data from the Office of Statistics, Korean National Hospital Discharge In-depth Injury Survey and National Health and Nutrition Survey and could confirm the differences by sex, age, and injury mechanisms. Furthermore, since a time-dependent injury trend could be identified if the status were to be continuously surveyed with the methods of this study, the data could be used as the basis for implementation of injury prevention programs. In addition, we found that the difference between males and females in injury incidence was dependent on age and severity for different injury mechanisms. Since this kind of increase in older females could be a factor that increases the burden of injury in South Korea, it is necessary to develop an injury prevention program that targets older females.
Although the scale of injury-induced mortality is generally used as the standard for understanding injury, it is just the tip of the iceberg. Because the severity of injury can differ depending on the injury mechanism, pathology, and prognosis, the injury status cannot be fully understood through the scale of mortality. This study is significant because it estimated for the first time in South Korea, the scale of mortality, hospitalization, and the OPD visits due to unintentional injuries.
The most critical issues in calculating the injury incidence rates are representativeness and generalizability [12]. The official statistics on injury mortality used in this study were collected from the entire South Korean population, and the data from representative samples were used for hospitalization and OPD visits due to injury. Therefore, we believe that representativeness and generalizability were established.
In this study, the injury pyramid was calculated by dividing the injury into 3 steps of mortality, hospitalization, and OPD visits including emergency room visits. The steps and definition of the injury pyramid are slightly different in the previous studies analyzing the injury pyramid for unintentional injury. While several studies divided the injury into mortality, hospitalization, and emergency room visits [6,7,13], our study divided injuries into mortality, hospitalizations, and OPD visits [14]. Yet another study divided injuries into 4 steps of mortality, hospitalization, emergency room visits, and general practitioner visits [15]. The National Emergency Department Information System provided the data for injuries of patients admitted to emergency rooms in South Korea. All the information about ill and injured patients who visited the emergency rooms of the sample hospitals were supposed to be entered into this data [16]; however, out of 419 nationwide emergency medical institutions, only 142 entered this data into the system. Therefore, the system lacks reliability, and it is difficult to generalize the results because the required question items differ depending on the size and staffing of emergency medical institutions. Because the system did not represent all of South Korea, the data were collected mainly from big cities, and thus a certain injury could have been overestimated [6]. We used the KNHNES instead. However, since KNHNES survey questions make no distinction between an emergency room visit and an OPD visit in a clinic or hospital due to injury, emergency room visits could not be calculated separately.
Most of the previous studies related to the injury pyramid were based on the incidence, as was the case in this study, but the study by Polinder et al. [15] used disability adjusted life years. We believe that this difference stemmed from the availability of the data.
Based on the results of this study, 1:54.04:230.55 was the unintentional injury ratio in South Korea. While it was 1:10.05:146.65 in the US [6], the hospitalization rate over the mortality ratio in South Korea is higher than that in the US. In a study by Walsh et al. [13] calculated the injury pyramid of children under the age of 16 years residing in Newcastle, the mortality to hospitalization to OPD visit ratio was 1:150.67:1,947, while the ratio for children under the age of 18 years in this study was 1:162.15:1,807.79, showing no substantial difference. However, in a study by Lee et al. [7] the injury pyramid of children and adolescents under the age of 19 years residing in Massachusetts, the ratio was 1:49:1,660; their mortality over hospitalization ratio was significantly lower than that in this study. We think that this difference comes primarily from the differences in the medical systems of different countries. For example, there may be situations for which hospitalization can be restricted because of the waiting period or the cost of hospitalization. In addition, severity of an injury and promptness of treatment can also have an impact. If severity of an injury does not require hospitalization or the injury is promptly treated, it might not lead to hospitalization. However, no such comparison data are available to prove this hypothesis.
In the sex-dependent unintentional injury scale analysis, the mortality scale of males was larger than that of females. While the injury-related hospitalization rate of females was higher than that of males in the over 75 years age group, the injury-related OPD visit rate of females was higher than that of males in the over 65 years age group. The number of older females is expected to increase rapidly in the future in South Korea, one of the rapidly aging nations worldwide. According to South Korea’s Office of Statistics, the number of females older than 65 years is 4,270,486 as of 2012 and is expected to increase to 9,438,528 by 2032, while the number of males older than 65 years is expected to increase from 2,771,025 to 7,180,41217; the absolute number of older females is estimated to be 1.3 times the number of older males. The incidence rate of falling injuries among males is less than that of females. However, the severity of such injuries among males is higher than that of females.
As the unintentional injury-related hospitalization and OPD visit to mortality ratio decreases, the mortality rate resulting from severe injuries increases. In this study, the hospitalization and OPD visit to mortality ratio of females aged 0 to 18 years was lower than that of males in the same age group; however, the ratio of males was lower than that of females in the over 19 years old group. This is because in the over 19 years old group, the unintentional injury-related mortality rate of males is higher than that of females. In a previous study conducted in Canada [3], the unintentional injury-related mortality rate per 100,000 males was 40.4, while it was only 20 for females.
The incidence rate of traffic-related injury was the highest in Korea. However, after analyzing the mortality, hospitalization, and OPD visit ratio, the ratio of hospitalization cases for 1 mortality for fall or burn/fire injuries, it was found to be higher than that of traffic-related injuries. The number of fatalities due to traffic-related injuries in South Korea was 19.1 per 100,000 persons in 2012, but declined to 11.9 persons in 2013 [18]. This is believed to be the result of advances in safety engineering techniques, educational approaches, and legal sanctions to reduce traffic accident-related mortality, which was among the highest worldwide in the past. However, as falls started to increase recently, the OPD visits due to fall injuries are now almost at the same level as the traffic-related injuries. Especially among females, the number of OPD visits due to fall-related injuries was higher than those due to traffic-related injuries, and it was the same for the number of hospitalizations, showing that fall-related injuries in females had a higher incidence rate than traffic-related injuries. The rate of fall-related injuries in females was reportedly higher than that in males over the entire lifespan in Canada [15]. It is known that fall risk is higher for females than it is for males because the prevalence of diseases such as osteoporosis is higher among older females than among older males. However, it is possible to develop fall prevention programs to meet the specific demands of males and females by identifying whether there is a difference in fall-related injuries in other age groups and what risk factors exist.
We propose the following actions based on this study. First, it is necessary to improve the quality of the data used. Although each data set used for the study included nationally representative and reliable injury-related data, each data set had limitations. Enough information could be obtained without an additional survey for injury-related fact finding if the quality is improved by minimizing these limitations. Second, it is necessary to conduct a survey to obtain injury-related data in regional communities. There can be differences in the injury-related mortality rate, hospitalization rate, and injury mechanisms among cities and farming communities of the same country [19,20]. Since the characteristics of the injury scale may be different in each regional community, a survey from which representative regional injury data on hospitalization and OPD visits can be obtained is a priority. This would help in conducting injury prevention and safety promotion programs at the regional community level with an evidence-based approach.
This study identified the characteristics of the injury mechanism-based pyramid for unintentional injuries and designed a framework to continuously estimate the changing trend of the scale of injury-related mortality, hospitalization, and the OPD visits. The limitations of this study are as follows. First, because this is a cross-sectional study, it is difficult for the results to fully reflect the changes in the health and social situations. Thus, estimation of the average values through a time-course design is considered necessary. Second, due to the limitation on the available data, there exists a potential bias in the results. The National Health and Nutrition Survey was used to estimate the OPD visit rate which was derived from responses about the patients’ experiences with medical institution visits due to injuries within 1 year, and inaccurate memory or a distorted time concept could lead to inaccurate answers about injury experiences. Third, factors that influence each injury mechanism were not excluded. Since injury reflects the medical service system or socioeconomic background [4], it is considered necessary to establish a national information system that includes information on these factors. Fourth, while the results of the mortality group are relatively accurate because it was a survey of the entire population, the results may vary for the OPD visit and hospitalization groups depending on the data selected because the values used were weighted after a stratified 2-stage extraction. To counteract these limitations, efforts to increase the reliability of data by expanding the scale of the survey samples are necessary. To obtain good quality data, we believe that improvements are necessary by standardizing the definitions and classification of injury mechanisms when collecting injury-related data.
The scale of unintentional injury varies depending on sex, age, and injury mechanism; additionally, there are differences in injury incidence between males and females depending on age and mechanism. Since the high incidence of injury in elderly people could be a factor that increases the burden of injury in South Korea, it is necessary to develop an injury prevention program that targets the elderly.