


INTRODUCTION
The number of deaths due to acute poisoning (AP) because of drug or substance ingestion tripled from 6,100 in 1999 to 36,500 in 2008 in the United States of America, exceeding the deaths due to traffic accidents [1]. Globally, unintentional AP caused 86,400 deaths at a rate of 1.2 per 100,000 individuals in 2015. Patients suspected of AP account for a substantial proportion of the visitors to emergency departments (EDs) [2].
In general, patients with AP have a mortality of 1% to 3%, which is lower compared to those of other diseases needing intensive care [3]. Clinical staff prefer the hospitalization of patients with AP in the intensive care unit (ICU) in case of additional risks, such as potential suicide attempts [4]. Nevertheless, it is crucial to predict patient mortality in order to identify those requiring intensive care for providing appropriate patient care as well as preserving medical resources. The development of tools that can stratify the severity of AP, based on clinical and laboratory parameters, can improve the approach and treatment of this condition, particularly in EDs with limited facilities.
A logistic regression (LR) model is the most typical means of predicting the risk of binary outcomes occurring due to risk factor exposure; however, this model has poor predictability for data based on small sample sizes [5]. Although King and Zeng [6] offer an extensive discourse on rare event data, substantial misconceptions remain on this issue.
In comparison, artificial neural networks (ANNs), which attempt to emulate neuronal networks in the human brain, have been created to address classification and prediction problems, and have particular relevance and application in medical science [7]. Although the ANN has been utilized as an alternative approach to LR, similarities in the statistical procedures exist between the two models. However, the predictor variables in a neural network (NN) usually undergo nonlinear transformation through each hidden and output node. Thus, an NN can generate a model with nonlinear relationships having substantially greater complexity than those in an LR model. Furthermore, ANNs can detect any complex nonlinear relationship between independent and dependent variables [8].
Data to support the replacement of standard statistical approaches by ANNs as the method of choice for the classification of medical data are insufficient [9]. Hence, both methods should continue to be used and explored in a complementary manner. To the best of our knowledge, there are no studies on the application of ANNs for the prediction of rare and fatal events in critical diseases, such as AP. In this study, the performances of general regression and ANN analysis are compared using data collected over several years from patients presenting to EDs with AP. Trained ANNs approach the functionality of a cluster in a fundamental manner, which we expect can perform triage in EDs as effectively as LR, and provide an additional tool for efficient resource and human resource management [7].
METHODS
Design and data collection
This study was designed as a multicenter, retrospective, and medical record review of patients with AP. Patients older than 15 years, who visited the emergency center of two tertiary care university hospitals in South Korea (Incheon St. MaryŌĆÖs Hospital and Yeouido St. MaryŌĆÖs Hospital) within 24 hours of drug or toxic substance ingestion, between January 2010 and December 2016, were enrolled in the study. Patients with poisoning associated with a suicide attempt or accidental exposure were also included. The study protocol was approved by the institutional review board of the Catholic Medical Center of Korea (DC20ZIS10034) and written informed consent was waived as all the data were retrospectively collected through retrospective chart review. The initial AP severity was classified based on the worst poisoning severity score (PSS) during the first 24-hour period in the ED [10]. The initial PSS was measured immediately on arrival at the ED by an ED clinician, whereas the final PSS was determined as the highest score during the entire hospital stay. For patients who were discharged or had died during the first 24-hour period, the PSS was checked once.
Patient monitoring and laboratory measurements were performed as part of routine patient management in the ED, and immediate appropriate medical care was offered for the clinical condition by the emergency medical personnel.
Classification of poisoning substances and risk point estimation in multiple toxins ingestion
To estimate the toxic effects in patients who had ingested multiple toxins simultaneously, we estimated the sum of risks of the poisonous substances. These substances were classified according to the ICD-10 (International Statistical Classification of Diseases and Related Health Problems) (T36ŌĆōT50) [11]. LR was performed by incorporating the number of ingested poisons in each class of toxic material as an independent variable and in each PSS group (high [3 or 4] or low [0ŌĆō2] risk) as a dependent variable. The maximum likelihood estimation value of each class of poison obtained through LR was considered a risk point, and the sum of the risk points (SRP) for all the ingested toxic substances was considered as the predicted risk of death for patients with multiple poisons ingestion. The calculated SRP was employed as one of the independent variables in univariate and multivariate LR, and ANN analysis was used to predict the mortality risk factors following mixed substance intake.
LR analysis
To identify the potential predictors of in-hospital death following AP, univariate LR analyses were performed incorporating the demographic informations, clinical characteristics, and laboratory variables. Multivariate LR analysis was performed for a combination of selected risk factors (screened in univariate analyses) exhibiting P-values less than 0.20. Results of the regression analyses were presented as odds ratios (ORs) with the accompanying 95% confidence intervals (CIs).
Backpropagation ANN modeling
All the data were randomly divided into training and test datasets at a ratio of 7:3. The backpropagation (BP) ANN model comprised three layers, input, hidden, and output, containing 14, 30, and 1 neuron, respectively. A total of 12 input variables, including age of the patient, diastolic blood pressure, pulse rate, Glasgow Coma Scale (GCS), PSS, PSS group, admission to the ICU, length of ICU stay, endotracheal intubation status, diabetes mellitus, and gastric lavage were employed in the model. All the hidden layers were fully connected, and the rectified linear unit was used as the activation function for each neuron in this layer (Fig. 1) [12]. The single output layer neuron indicated 1 or 0 for death or survival, respectively. The ReliefF algorithm was used for feature ranking and selecting the relevant features (ReliefF >0.2).
Statistical procedures
Continuous data were presented as the median and interquartile range (IQR), whereas dichotomous data were presented as the number and percentage. The significance of differences between the two groups were evaluated through the unpaired Wilcoxon rank-sum test for continuous variables, whereas the chi-squared test or Fisher exact test, as appropriate, was applied for dichotomous variables. LR analysis and the ANN model were developed for predicting the occurrence of mortality in patients with AP. The ANN structure included 30 hidden layers, and each hidden layer had 12 nodes. The receiver operating characteristic (ROC) curves were plotted, and the empirical method of Patel and Goyal [7]. was used to compute the area under the curve. The Wilcoxon signed-rank test statistic, based on pairwise comparisons, was used to determine the differences between the area under the curves of the two statistical methods. P-values <0.05 were considered statistically significant. The statistical analyses were performed using Orange ver. 3.23, an open-source machine learning toolkit (University of Ljubljana, Ljubljana, Slovenia), and RStudio ver. 1.2.5033 (RStudio Inc., Champaign, IL, USA).
RESULTS
Patient characteristics
A total of 1,304 poisoned patients (>15 years) had visited the ED during the previously mentioned study period. Among these, 434 men and 870 women were included in the study. Table 1 lists the general characteristics of the study population group. A total of 12 patients died in the ED or following hospital admission. The median age of ED arrival was 44 years (range, 15ŌĆō96 years; IQR, 29ŌĆō57) in the survival group, which was significantly lower than that of the death group at 72 years (IQR, 57ŌĆō75). Patients in this ŌĆ£deathŌĆØ group had visited the ED after ingesting 1.8 (IQR, 1ŌĆō2) substance compared to a median of 2.2 (IQR, 1ŌĆō3) substance in the survival group (P=0.410). Besides, the GCS, PSS, ICU admission, rate of diabetes, and endotracheal intubation status differed significantly between the two groups.
ANN analyses
In the BP ANN model, age, GCS score, ICU admission, and endotracheal intubation status were the crucial factors among the 12 independent variables indicated for mortality. Thus, according to the LR as well as ANN models, age, ICU admission, and endotracheal intubation status were the common risk factors.
Comparison between the two models
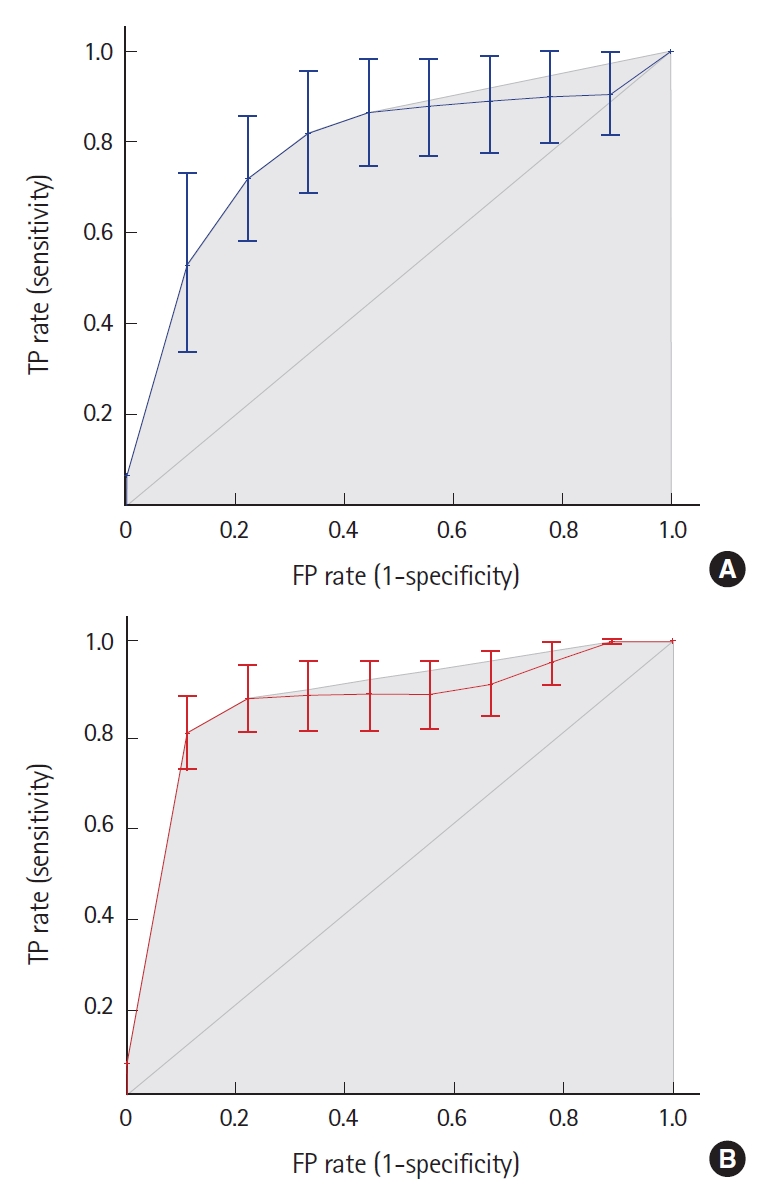
The area under the ROC curve (AUROC) was obtained applying the two models constructed using the test data set for mortality identification (Fig. 2). The accuracy of mortality prediction was evaluated through ROC curve analysis, comparing those of the BP ANN and LR models. The AUROC of the BP ANN model was 0.88 (95% CI, 0.77ŌĆō1.00), which was significantly higher than that of the LR model (0.74; 95% CI, 0.59ŌĆō0.90) (P=0.042) (Table 4).
DISCUSSION
The ability to predict the exact risk of mortality at an early stage during the treatment of critical patients in the ED is crucial for patient triage and improving outcomes. It has been demonstrated that the ANN model has good prognosis prediction for numerous disease conditions and superiority over conventional predictive models, even when the same input variables are used for model generation [7]. The findings of this study confirm that the ANN model predicts the mortality of AP patients in the ED more accurately than LR.
A preceding study on critical patients with sepsis treated in the ED indicated that the ANN could predict the possibility of death more precisely than LR [13]. Another study on patients presented in the ED with acute coronary syndrome also showed better prognosis prediction with an ANN ensemble model, compared to an LR model [14]. In a study comparing the ability of an ANN model with that of a severity scoring system, the acute physiology and chronic health evaluation II score (APACHE II), for predicting the mortality of patients admitted to the general ICU, the ANN model predicted 336 among the 337 deaths, whereas the APACHE II predicted 246 deaths [15].
The ANN algorithm possesses an automatic handling function for missing values and performs feature selection enabling the model to perform comparable functions as the LR model, requiring considerably less effort. Another advantage of the ANN model is that preprocessing is not necessary. The LR model has a relatively simple approach for modeling NNs employing a fully connected layer of the feed-forward network without hidden layers, using a sigmoid activation function. Thus, the ANN can potentially model more complicated nonlinear relationships than the LR [16]. However, a limitation of ANN modeling is the requirement for state-of-the-art software, in addition to the considerable computer resources for training and testing NNs.
In comparison, the LR model can clarify the variables that provide the strongest predictability of an outcome based on the magnitude of the coefficients and the associated ORs. Moreover, LR analysis can eliminate independent variables that are not related to a particular outcome of interest through a stepwise variable selection process, whereas the ANN model may contain several unimportant predictor variables that may remain unrecognized, compromising or complicating model application. The existence of a statistical relationship between a predictor variable and an outcome alone in an ANN model does not imply causality. LR models are superior to NNs in identifying possible causal relationships [8]. This lack of interpretability at an individual predictor level is one of the most criticized features of ANN models [16]. Furthermore, ANNs exhibit difficulties with generalization, producing models that can overfit data. To improve generalization, internal cross validation was performed in this study; however, external validation may also have been beneficial.
Previous studies have shown that among patients with AP, older individuals were more prone to death or prolonged ICU stay, with each 10-year increase in age associated with a 0.36 increase in the OR for death [17,18]. The results of this study also indicate that age is a critical factor for death following AP, with eight of the twelve deaths occurring in patients aged 60 or older. Age was identified as a common risk factor for mortality by the LR as well as ANN models.
Five PSS grades (0, none; 4, fatal poisoning) were created for symptoms or signs of organ failure following AP [10]. PSS generates a very high AUROC value for death risk because all the causes of death are grade 4 on this scale. PSS needs to consider the overall clinical progression and must be applied according to the most severe symptomatology, and the clinician needs to collect considerable data from the 12 organ systems. As PSS scores are subjective and have low interperson reliability because judgments such as mild, moderate, and prolonged can be confounded [19], it was excluded from the independent variables when comparing death predictability. PSS was used only as a dependent variable to score risk points for toxic substances in order to measure the risk score in patients with suspected ingestion of multiple substances in AP.
The number of toxic substances did not constitute a significant factor in mortality prediction, even though toxic substances received four points from the PSS as the associated complications are highly related to death. Patients with AP due to multiple agents or mixed drug overdoses are common in the ED. A study from Taiwan showed that 208/1,507 (13.8%) patients were exposed to more than one agent [20]. In addition, the study showed that patients ingested a median of 1 (range, 1ŌĆō16) type of substance and that 569/1,304 (43.6%) patients consumed two or more medications on average [20]. Patients with mixed poisoning constitute a considerable challenge to ED staff and present increased difficulty with regard to decontamination and treatment compared to poisoning with a single agent. Rogers and Heard [18] found an increase in the relative rate of death ranging from 1.2 to 7.1 for each poisoning agent with each 10-year increase in age. In this study, neither the number of poisoning substances nor the SRP of each ingested substance was significantly associated with mortality. Further research is required to clarify the reasons for this discrepancy.
This study has several limitations, including small sample size and relatively sporadic outcome events. However, more than 10 outcome events for each independent variable are generally acceptable [21]. The samples used in our model are appropriate because 12 events were observed in 1,304 individuals for a single outcome variable [22]. Clermont et al. [23] designed a prospective study with a small sample size of 1,647 patients in intensive care. They compared the LR and ANN models using a random training set of 1,200 patients and the remaining 447 patients as the validation set. They iterated model construction on progressively smaller training sets and repeated prediction with the same validation set. As the size of the training set decreased, the performance of the model with the validation set decreased rapidly, demonstrating poor fit with under 800 samples. In comparison, this study utilized 1,292 samples, with 912 patients used as the training set to ensure proper fit.
Liisanantti et al. [24] reported that respiratory and renal dysfunction or failure following AP are among the risk factors for in-hospital mortality. However, the parameters from the laboratory data for renal, cardiovascular, and respiratory dysfunction were not included in this study. The focus of this study was not to identify the risk factors in order to compare LR and ANN for death prediction. As mentioned previously, such lack of interpretability at the level of individual predictors is one of the most criticized features of ANN models [16].
A predictive tool is urgently required to estimate the mortality risk for patients with AP in the ED, which can serve as a guideline for medical decisions and patient disposition. In this study, a novel ANN model was developed and validated to determine the mortality risk for patients with AP during initial ED assessment. Trained ANNs approach the functionality of a cluster in fundamental manner, which we expect would perform triage in EDs as effectively as LR and provide an additional tool for efficient resource and human resource management. Nevertheless, further optimization of the model is necessary for more accurate predictions.