


INTRODUCTION
Artificial intelligence (AI) and machine learning (ML) are powerful technologies that have the potential to improve medical care [1]. AI refers to the broader concept of technology being able to carry out tasks in an autonomous and smart way, encompassing a variety of technologies, while ML is a subset of AI focused on the idea that machines can learn from data, identify patterns, and make decisions with minimal human intervention [1–4]. Particularly in emergency medicine, AI and ML are expected to play critical roles in accelerating triage, diagnosis, and prognostication to optimize individual patient care through the input of clinical information and/or image recognition [2,4–8]. Furthermore, streamlined clinical documentation or recording using natural language processing is expected to make these tasks more efficient [9–11]. These technologies will also contribute to drug discovery, patient monitoring, resource allocation, and epidemiological surveillance [12–15].
Despite expectations that emergency physicians will become general users of AI and ML in the near future, critics are doubtful whether they can trust and rely on AI and ML models [16]. Physicians are usually not experts in AI and may not have an in-depth understanding of it or ML. When an AI model outputs a medical classification or prediction, without necessarily “explaining” the underlying process or showing the variables and weights driving the prediction, physicians who are not familiar with AI algorithms may perceive an AI model as a “black box.” Such a situation may lead to doubt and mistrust in AI output, a major challenges for implementation of AI and ML tools in clinical settings [17].
To address these concerns, the concept of “explainable AI” has been highlighted as a possible solution for successful implementation of AI and ML in medical practice [18–20]. Explainable AI aims to teach the functioning of AI systems to end-users, researchers, or developers [18–20]. As more accurate, complex models are developed, it may become increasingly difficult to understand how they work. This review introduces the definitions, importance, and role of explainable AI and covers potential related challenges in emergency medicine.
WHAT IS TRANSPARENCY, INTERPRETABILITY, AND EXPLAINABILITY IN AI?
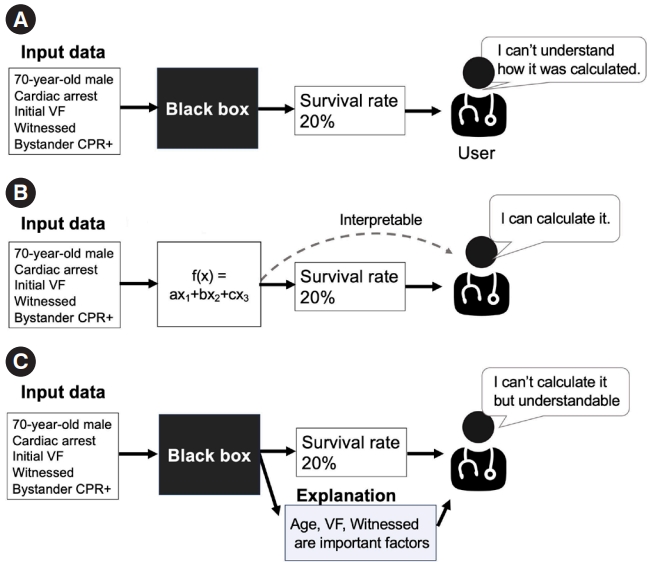
Before discussing the concept of “explainability,” we introduce the terms “interpretability” and “transparency” [18–20]. While these terms have distinct meanings, they are sometimes mistaken for explainability. AI models are often labeled as a “black box,” suggesting a lack of transparency, as shown in Fig. 1A [21]. In an opaque model, the conversion of an input to an output is invisible, making it challenging for users to understand the process. In contrast, transparent/interpretable models allow users to understand how inputs are processed to produce outputs to observe operation of a model, as shown in Fig. 1B. As shown in Fig. 2, straightforward models like linear regression with a limited number of variables or a decision tree with a few branches are easier to understand [21].
Explainability is different conceptually. Arrieta et al. [19] suggested that, “Given a certain audience, explainability refers to the ability of a model to show details and make its internal functioning clear or easy to understand.” This definition emphasizes the audience’s perspective, which can vary by background, experiences, and capacities, resulting in different needs of explainability in ML. While explainability is inherent in transparent models, it is also tied to post hoc explainability, as shown in Fig. 1C. This concept refers to techniques that provide a rationale or explanation to support user understanding of model operation even if the model itself is noninterpretable (often referred to as a “black box”); this may be achieved by providing text or a visual explanation, etc. [22].
WHY IS EXPLAINABLE AI NEEDED IN EMERGENCY MEDICINE?
There are four main reasons why explainable AI is required in clinical settings: justification, control, improvement, and discovery of novel ideas [23]. These four reasons may appear to overlap, but from a clinical perspective, they capture different motivations.
First, explainable AI is useful to justify AI model outputs, to enhance trust, and to support clinical decision-making [23]. Generally, clinicians need to explain a medical condition, treatment plan, and expected outcomes to patients and their families. Despite medical complexity, clinicians need to make the effort to communicate to the patients and their families to facilitate shared decision-making and trust [24]. Thus, explainability is important in a medical decision-making process, and the results generated from clinical AI or ML need to be handled appropriately to build trust. In the absence of a clear and satisfactory explanation, clinicians will likely be hesitant to trust AI. For example, a recent randomized control trial investigated the efficacy of an AI model that aims to detect cardiac arrest cases at the dispatch center using voice data analysis during an emergency call [25,26]. The study was unable to demonstrate the effectiveness of the AI model, with the researchers suggesting that some dispatchers might not have trusted the output from the AI model due to the absence of a reasonable explanation. Explainable AI can produce an auditable and testable way to defend algorithmic decisions as fair and ethical [27,28].
Second, explainability helps users maintain control of a complex technology. Indeed, a deeper understanding of AI models increases awareness of vulnerabilities and flaws [23], which can help to quickly identify and correct (debug) errors in critical situations. Thus, user controls can be strengthened. If the AI generates unexpected results and unreasonable explanations inconsistent with clinical experience or show potential risk of bias/discrimination, clinicians can bypass the AI and review results for errors or bias [29]. For example, if a patient is unexpectedly evaluated as having low likelihood of a favorable outcome, mainly driven by ethnicity or socioeconomic status of the patient, clinicians may suspect hidden discrimination or bias in the AI training data [30,31].
Third, explainability of AI models is needed to allow continual improvement. If AI models can discuss the process used to produce specific results, the information can be used for further improvements [32]. For example, when an AI model does not accurately predict an outcome, its process can be determined using explainability features. If a certain predictor highly contributes to a model but carries a risk of measurement bias due to the absence of standardized definitions in clinical settings, the model might be improved by excluding the variable or standardizing the input. In this way, explainable AI can lay the groundwork for continuous iteration and improvement.
Furthermore, explainable AI may allow development of new ideas, hypotheses, and knowledge [22]. For example, if an explanation from an AI model shows an unexpected contribution of a certain risk factor to the prediction of outcomes, a novel hypothesis might be developed regarding this factor and its association with outcomes. In an AI study investigating clinical subgroups of cardiac arrest patients treated effectively with extracorporeal cardiopulmonary resuscitation (ECPR), creatinine value was associated with outcome. This led to the development of a novel score for indications of ECPR that included creatinine [33]. The importance of explainable AI is increasing with the more critical role of AI in clinical settings.
HOW DOES EXPLAINABLE AI WORK?
Explainable AI encompasses three main approaches [18–20]. The first is pre-modeling explainability, such as data visualization, summarization, and transformation [34]. Before deploying AI in clinical settings, it is essential to grasp the data structure, patients’ characteristics, time trends, and proportion of the outcome for an appropriate understanding of the AI. This may include simple descriptions, such as mean, standard deviation, and range, and missing data using data visualization or summarization. Data transformation is also crucial to change row data into a usable format or structure [34]. For example, when developing ML models, clinical data such as the date of incidence, time of emergency call, and hospital arrival are generally transformed to the month or day of an incident or the duration between the emergency call and the time of hospital arrival, allowing easier analysis. Data transformation is more applicable to development and understanding of models.
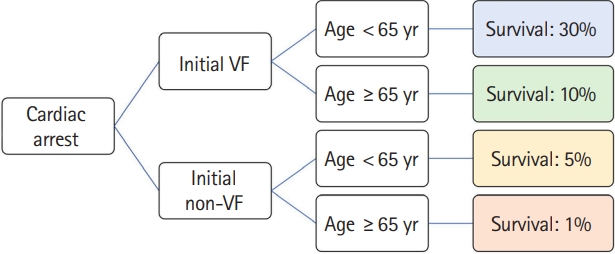
The second approach is to develop an interpretable model with inherent understandability or a blend of different model types [18–20]. Models exhibit various levels of interpretability and transparency: at the level of the training algorithm (referred to as “algorithmic transparency”), at the component level (known as “decomposability”), and at the level of the model itself (or “simulatability”) [22]. For example, as shown in Fig. 2, a tree model might pose a human-understandable question, such as whether the patient is younger than 65 years to clarify the prediction process and enhance algorithmic transparency. Such a model can be broken down into individual segments, like patients with or without initial ventricular fibrillation (VF) (Fig. 2). This allows users to identify the contribution of each segment to the overall output, showcasing decomposability. In an example of a 40-year-old cardiac arrest patient with initial VF, we can follow the entire prediction pathway of the model, estimating a survival probability of 30%, without specialized mathematical tools. This demonstrates simulatability, with model transparency and user-friendly interpretation.
A hybrid interpretable model approach has also been proposed [18–20]. It includes a set of methods that attempts to combine a complex black-box model with an inherently interpretable model to build an interpretable model that achieves comparable performance to the black-box model. The AutoScore framework is an example of this hybrid interpretable model approach [35,36]. In this framework, development of an ML model is complicated, but the final result is familiar to users [5,35,37].
The last method is called post-modeling explainability [18]. It helps break down complex developed AI models so that they are easier to understand. These techniques were created based on human understanding.
POST-MODELING EXPLAINABILITY
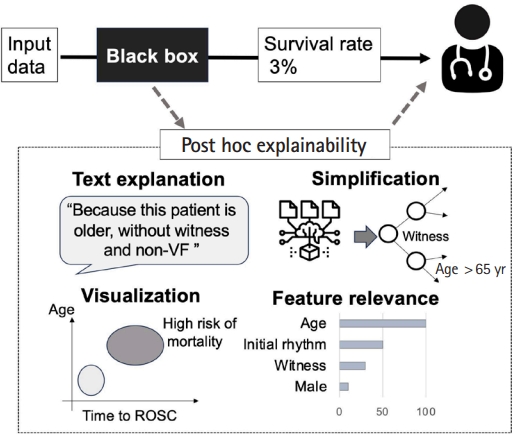
In this section, we introduce some examples of post-modeling explainability. Fig. 3 shows several categories of post-modeling explainability, including visualization, textual justification, simplification, and feature relevance [22].
Text explanations improve the understanding of ML models by generating text-based explanations in the form of phrases or sentences using natural language generation methods. Examples include AI models used to classify pathological images, which attempt to provide user-friendly explanations [38]. These models can generate sentences such as: “The input image is diagnosed as tissue A type for sure because it could not be misclassified to any other tissue types”; “The input image is suspected as tissue B type, and there is a low possibility that it could be tissue C type, D type, or E type”; or “The input image is tissue A type. However, there is a possibility that it could be tissue F type.” These explanations about the possibilities of misclassification provide rationale for predictions and help clinicians with their decision-making (Fig. 3).
Visual explanations describe models by applying techniques that aim to visualize the model behavior. Popular literature makes use of dimensionality reduction techniques to produce simple visualizations that can be easily interpreted by humans. Visual explanation is particularly effective in conveying complex interactions between variables [18–20]. For instance, when describing black-box models to predict the probability of favorable outcomes for cardiac arrest patients, the interactions between probability and some factors (such as age and transport time to the hospital) are difficult to recognize. In explainable AI, these variables can be plotted along the x-axis and y-axis, respectively, to create a scatter plot (Fig. 4) of the distribution of the possibilities [39]. This approach visualizes the predicted probability of interaction between the factors.
Simplification creates a straightforward, less complicated interpretable model from a black-box model [22]. One example of simplification is selection of a single decision tree as the representative of a random forest ensemble of numerous decision tree models [40,41]. A simplified model could aggregate predictions from the individual trees to produce a final output, as shown in Fig. 3 [42]. Although this approach is commonly utilized in medical research, the results can be challenging to interpret due to the ensemble nature. Identifying a single tree that captures the primary patterns and behaviors of the entire forest allows a balance between interpretability and performance [40,41]. This representative tree can be visualized, providing insights into the decision-making process using the same foundational logic as the original ensemble. Another example is the local interpretable model-agnostic explanations (LIME) approach [43], which approximates a complex black-box model with a simpler and more easily interpretable linear regression model. This is achieved by generating numerous samples of input data, predicting their outputs using the original model, and then training a linear model on these samples with emphasis on those close to the original data point. LIME can identify the feature importance that contributes most to each prediction and helps users determine the factors most crucial in the, as explained below.
Explanation by feature relevance aims to provide post-modeling explainability by assessing the internal processes of an algorithm. This type of explanation is commonly utilized in ML models in emergency medicine [33,44–47]. It calculates relevance scores for all variables managed by the algorithm to quantify the importance of features critical to model decisions. Shapley Additive Explanations (SHAP) is one of the methods used to evaluate the contribution of each input feature to AI model operation [48,49]. Similar to LIME, SHAP performs local linear approximations to explain the predicted risk for each individual. However, it uses a different approach that allows more desirable properties than LIME in terms of local accuracy and consistency (for details, please see the reference) [49].
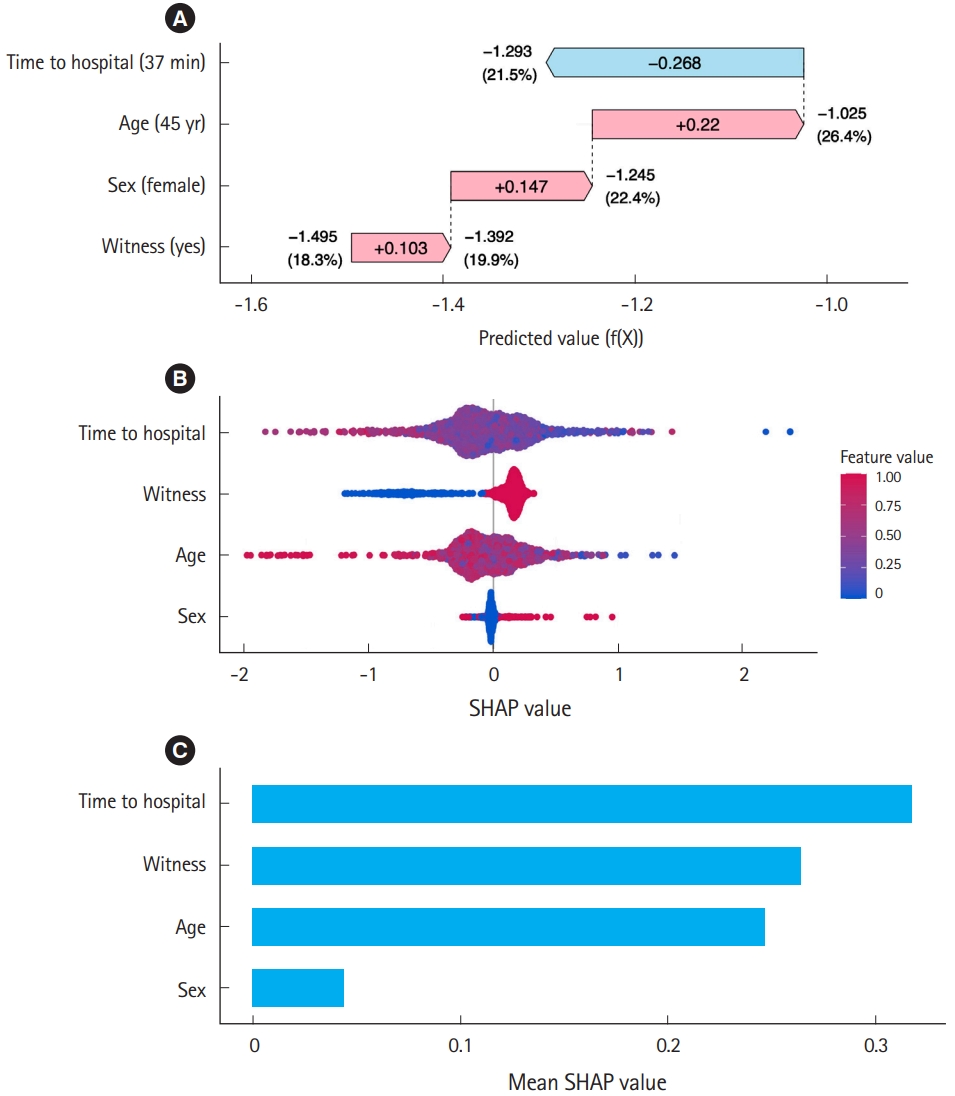
SHAP can quantify and visualize how each factor increases or decreases risk from baseline to reach the predicted risk for each individual using a waterfall plot, as shown in Fig. 5. Consider an ML model that predicts the survival rate of cardiac arrest patients using sex, age, witness status (yes/no), and time to the hospital from the emergency call (minutes). For example, consider a 45-year-old female with witnessed arrest and a time to hospital of 37 minutes. This ML model predicts her survival rate as 21.5%. The waterfall plot in Fig. 5A demonstrates how these four factors influence the prediction of ML. In this case, the baseline of the predicted value (f(X)), i.e., the average prediction across all cases, is –1.495, which translates to a baseline survival rate of 18.3% via the inverse logit function [1/(1+e(–f(X)))]. The witnessed status increases the predicted value by 0.103, which is equivalent to an increase in the survival probability to 19.9% from baseline. This 0.103 increase in the predicted value attributable to the witnessed status is the SHAP value of this factor for this individual. The patient’s sex (female) has a SHAP value of 0.147, which further increases the survival probability to 22.4%. Additionally, the patient’s age (45 years old) has a SHAP value of 0.22, which increases it further to 26.4%. However, the time taken to reach a hospital, which has a negative SHAP value of –0.268, reduces the survival rate to the final predicted value of 21.5% for this particular case. Through this example, we can understand how each variable impacts the model prediction using a waterfall plot and SHAP values. This demonstrates how SHAP can provide local explanations for individual predictions. When the contributions to the predicted risk of each factor are visualized across all patients in a beeswarm plot (Fig. 5B), the relationships between factor levels and contributions to prediction can be determined, facilitating a straightforward comparison of the impact of each factor on the prediction.
SHAP is also valuable for global explanations to understand how the model behaves overall. This is done by considering all data points using the average absolute SHAP value. For example, the bar plot in Fig. 5C indicates that the average absolute SHAP value of “time to hospital” is highest, while those of “witnessed” and “age” are lower but still considerably high compared to that of “sex.” The model suggests time to hospital, witnessed status, and age as strong predictors of survival. This dual capability allows users to understand both specific decisions of the model and the broader trends and behaviors across data points.
CHALLENGES IN IMPLEMENTATION INTO CLINICAL SETTINGS
Even though the explainability of AI has advanced, there remain several challenges to the implementation of AI models in clinical settings. One of the issues is whether the explanation is acceptable and trustworthy enough from the points of view of clinicians and patients [16,18–20]. Previously, an explainable AI model was developed to predict the deterioration of patients with subarachnoid hemorrhage in the intensive care unit. To enhance the implementation of the AI tool, the perception gap between the developers and clinicians was investigated [50]. Through interviews, the study found that the developers believed that clinicians must be able to understand model operation and developed the AI model with explainability by providing SHAP values, as mentioned above. In contrast, from the perspectives of the clinicians, the SHAP value was not sufficiently helpful in understanding or trusting the AI model. Clinicians were more focused on clinical plausibility based on the pathophysiological rationale or clinical experience and a holistic approach referring to the multispectral clinical information. As illustrated in this example, the kind of explainability required depends on the audience and context of use of the AI model [19]. In emergency settings, the contexts and patient conditions change rapidly. Especially during resuscitation, which is an incredibly time-critical situation, clinicians may not have adequate time to try to understand how AI models work. Therefore, a model must be understandable quickly. Furthermore, it is a challenge to assess the quality/effectiveness of explainability. A previous systematic review reported various methods for assessing explainable AI effectiveness, with few established methods [51]. Establishing standardized approaches to measure the effectiveness of explainable AI might increase its integration into clinical settings and act as a tool of communication among clinicians, researchers, and developers [28]. Finally, with increasing emphasis on fair and trustworthy AI-assisted decision-making in clinical settings, the contribution of explainable AI to model development should be determined through a multidisciplinary approach [52]. Considering such situations, collaboration among AI developers, researchers, and clinicians in designing explainable AI systems is imperative for improving their effectiveness, usability, and reliability in healthcare.
CONCLUSION
This paper summarizes the concept of “explainable AI” for clinicians in emergency medicine. With the expected increasing role of AI in medicine, emergency physicians and researchers will need to become knowledgeable about its use. Furthermore, a multidisciplinary approach is essential to develop trustworthy AI for use in clinical emergency medicine. This review will help interpret explainable AI to clinicians working in emergency departments.