1Department of Emergency Medicine, Seoul National University Bundang Hospital, Seongnam, Korea
2Department of Emergency Medicine, Seoul National University College of Medicine, Seoul, Korea
3Department of Epidemiology, Seoul National University Bundang Hospital, Seongnam, Korea
4Medical Research Collaborating Center, Seoul National University Bundang Hospital, Seongnam, Korea
Correspondence to: Kyuseok Kim Department of Emergency Medicine, Seoul National University College of Medicine, 103 Daehak-ro, Jongno-gu, Seoul 03080, Korea E-mail: dreinstein70@gmail.com
Received: January 30, 2018 Revised: April 11, 2018 Accepted: June 26, 2018
To investigate the epidemiology of sepsis in Korea and identify risk factors for death in sepsis.
Methods
We conducted a longitudinal, population-based epidemiological study of sepsis in Korea from 2005 to 2012 using the National Health Insurance Service-National Sample Cohort, a population-based cohort representing 2.2% of the Korean population. The primary objective was to assess the incidence, mortality and cost of sepsis. The secondary objective was to identify the risk factors for death in sepsis. Claim records of admitted adult patients (aged ≥15 years) were analyzed. Sepsis was defined as 1) bacterial or fungal infection or the conditions they often complicate, 2) prescription of intravenous antibiotics, and 3) presence of any organ dysfunction. Comorbidities were defined using the Charlson/Deyo method. Risk factors for 6-month mortality were assessed using multivariable logistic regression.
Results
A total of 22,882 cases were identified. Both incidence and 6-month mortality increased from 265.7 (95% confidence interval [CI], 254.7 to 277.1) to 453.1 (95% CI, 439.0 to 467.5) per 100,000 person-years (P-trend <0.001) and from 26.5% (95% CI, 24.4% to 28.8%) to 30.1% (95% CI, 28.4% to 31.9%), respectively. After standardization, the increasing trend of incidence was slower but still significant (P-trend <0.001), while that for mortality was not (P-trend 0.883). The average cost increased by 75.5% (P-trend <0.001). Multivariable logistic regression identified various risk factors for mortality.
Conclusion
The burden of sepsis in Korea was high and is expected to increase considering the aging population. Proactive measures to curtail this increase should be sought and implemented.
The incidence of sepsis and mortality have increased worldwide. The epidemiological characteristics of sepsis in Korea are yet unknown.
What is new in the current study
Although the incidence of sepsis in Korea has increased, the mortality rate has remained steady.
INTRODUCTION
Sepsis is defined as life-threatening organ dysfunction caused by a dysregulated host response to infection. It has very high morbidity and mortality rates and is a public health problem worldwide [1,2].
To improve its outcomes, it is critical to provide optimal management in every aspect of care including initial screening, hemodynamic optimization, antibiotic treatment, and source control [3]. This requires rapid but coordinated approaches from multiple disciplines including the general public, emergency medical service, and hospitals with the support of proactive governmental policies. In this process, detailed national epidemiologic information about sepsis can play a critical role. However, no nationwide population-based study has been conducted in Korea compared to many other developed countries where such epidemiological information has been used to support healthcare policy making [4-20].
We conducted a longitudinal, population-based epidemiological study of sepsis in Korea using a nationally representative cohort database. The primary objective of the study was to estimate the incidence, mortality and cost of sepsis in Korea. The secondary objective was to identify risk factors for death due to sepsis in the Korean population.
METHODS
This study was approved by IRB of Seoul National Bundang Hospital, institutional review board determined the study was exempt (SNUBH IRB X-1502-288-903).
Data source
The data source was the National Health Insurance Service-National Sample Cohort, a population-based cohort established by the Korean National Health Insurance Service [21]. It contains claim information of over one million individuals (2.2%) who were randomly sampled from almost the entire Korean population using stratification. It provides information about diagnoses, prescriptions, procedures, and related costs as well as basic demographic information such as age, sex, and socioeconomic status. Diagnoses are coded using the Korean Classification of Diseases, sixth revision which is based on the tenth revision of the International Statistical Classification of Diseases and Related Health Problems (ICD-10). It also contains information about disability and death based on the disability registration data and the officially-issued death certificates, respectively. We used its most recent release which contains claim data from 2005 to 2012. The detailed description of the cohort can be found in a previous paper [21].
Case selection and the variables analyzed
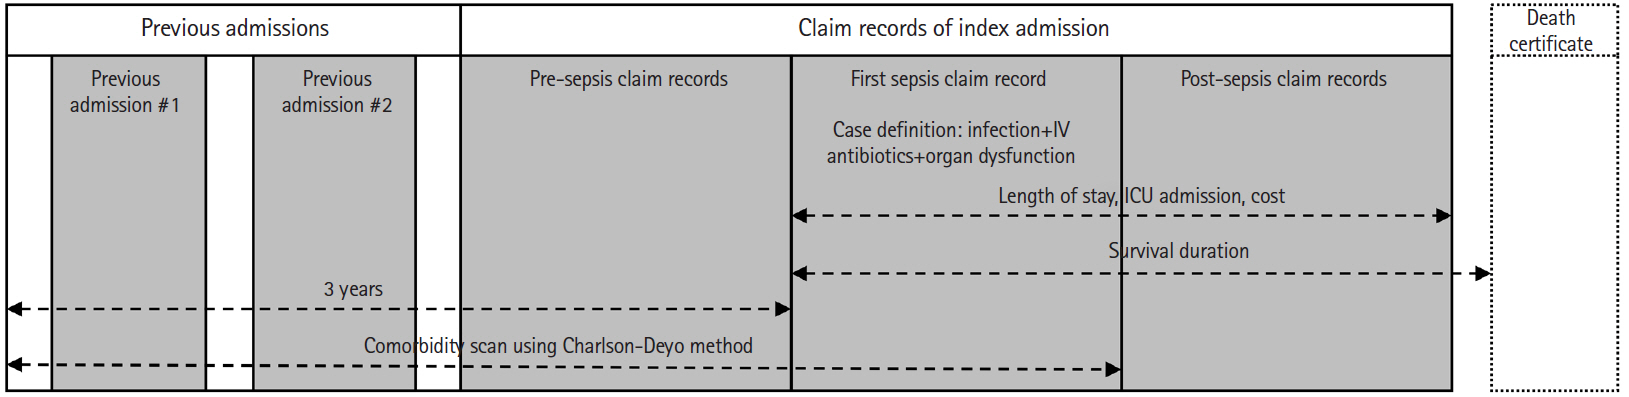
Claim records of adult patients (aged ≥15 years) admitted to hospitals were used for case definition. We identified sepsis using the following procedures (Fig. 1). The entire claim information for an admission is often separated into multiple records covering different time segments of admission. Therefore, we first linked successive claim records corresponding to each admission. Then a case of sepsis was defined as an admission with at least one occurrence of claim record fulfilling all the following conditions: 1) bacterial or fungal infection or the conditions that are often complicated by such infections (e.g., surgical abdomen) as indicated by the primary or first secondary diagnostic codes (please refer to the Appendix 1 for a detailed list of ICD-10 codes), 2) prescription of intravenous antibiotics (parenteral antibiotics with Anatomical Therapeutic Chemical Classification System code J01), and 3) presence of organ dysfunction involving at least one system (please refer to the Appendix 1 for a detailed list of ICD-10 codes). Septic shock was defined as the inclusion of R57.2 (septic shock) in the diagnostic codes or the use of intravenous vasopressors such as dopamine, dobutamine, norepinephrine, vasopressin, and epinephrine.
Comorbidities for each of the cases were defined using the first claim record fulfilling the sepsis criteria and the admission claim records within three years prior to the first sepsis record using the Charlson/Deyo method [22-24]. Ancillary variables including household income level, emergency room (ER) presentation, type of admitting department, and hospital capacity measured by the number of beds were also included in the analyses. Length of stay, overall cost, intensive care unit (ICU) admission and 6-month mortality were included as outcome measures. We excluded the claim records beginning more than a year after the event when calculating the length of stay and cost because we thought prolonged admission more than a year after the index event would hardly be due to the index event. The detailed coding schemes are available in the Appendix 1.
Statistical analysis
Both crude and standardized annual incidence of sepsis in the adult population (aged ≥15 years) were calculated. The standardized annual incidence based on the sex-age distribution of the 2010 Korean census was estimated by direct standardization [25]. Similarly, both crude and standardized 6-month mortality were calculated using the direct standardization method based on the sex-age distribution sepsis cases for the year 2010. The average (both mean and median) cost per case and the total national cost for each year were estimated in Korean won (KRW). The standardized annual average cost based on the sex-age distribution of sepsis cases from 2010 was also calculated. The trend analyses for dichotomous events were conducted using logistic regression, and those for continuous variables were conducted using linear regression.
Survival curves for the sepsis patients during the first six months were plotted using the Kaplan-Meier method and comparisons between groups were made using the log-rank test. To identify independent risk factors for mortality, we performed multivariable logistic regression analyses using two different model-building schemes. The first involved comprehensive modeling using all available variables and data. The second involved parsimonious modeling with a variable selection scheme based on Bayesian information criterion using 80% of randomly selected cases (training set) which was later tested using the remaining 20% of cases (test set). The results of the logistic regression were presented as odds ratios and their 95% confidence intervals (CIs). All data handling and statistical analyses were performed using R ver. 3.3.2 (R Foundation for Statistical Computing, Vienna, Austria).
RESULTS
From 2005 to 2012, a total of 22,882 sepsis cases were identified from the cohort (Table 1). More than half of the patients (14,028; 61.3%) were older than 65 years and had at least one comorbidity (11,615; 50.8%). Over half of the cases initially presented to the ER (13,128; 57.4%) and over two-thirds were treated in the medical department (16,212; 70.9%). Their income levels showed a polarized pattern with almost half of the cases (11,836; 51.7%) in the lowest and highest income classes. Majority of the cases (17,619; 77.0%) were treated in larger hospitals with capacities of 300 beds or higher. The most common type of organ dysfunction was respiratory failure (11,854; 51.8%) followed by hemodynamic failure (10,792; 47.2%) and the most common site of infection was the respiratory system (12,255; 53.6%). Almost half of the cases were complicated by septic shock (10,570; 46.2%) and almost one-third of the cases involved ICU admission (7,131; 31.2%). The median length of stay was 13 (interquartile range, 7 to 26) days and the median cost was 276 (interquartile range, 144.2 to 621.8)×10,000 KRW and the 6-month mortality rate was 29.5%.
Fig. 2 shows the eight-year trend of sepsis incidence and mortality. There was a significant increase in crude incidence rate of sepsis from 265.7 (254.7 to 277.1) per 100,000 person-years in 2005 to 453.1 (439.0 to 467.5) per 100,000 person-years in 2012 (P-trend <0.001). After standardization for both age and sex, the increase was less remarkable but still significant with 287.7 (275.8 to 300.1) in 2005 to 395.1 (382.7 to 407.8) in 2012 (P-trend <0.001). The increase was more remarkable in the elderly population and the patients with significant comorbidity burdens. The crude mortality rate also gradually increased from 26.5% (24.4% to 28.8%) to 30.1% (28.4% to 31.9%) during the period (P-trend <0.001). However, the trend was not significant after sex-age standardization (from 29.3% [95% CI, 26.9% to 31.9%] to 30.5 [95% CI, 28.5% to 32.6%]; P-trend=0.883). The crude mortality rate among patients with septic shock also gradually increased from 32.2% (28.8% to 35.9%) to 38.5% (35.6% to 41.5%) during the period (P-trend <0.001, Supplementary Fig.1). However, the trend was not significant after sex-age standardization (from 36.8% [95% CI, 32.8% to 41.8%] to 36.9 [95% CI, 34.1% to 39.9%]; P-trend 0.564).
The standardized average cost per case increased by 75.5% from 422.5 (95% CI, 396.9 to 448.1)×10,000 KRW in 2005 to 741.7 (95% CI, 701.5 to 781.9)×10,000 KRW in 2012 (P-trend <0.001) (Fig. 3). The estimated total national expenditure on sepsis was tripled (311.8%) during the same period with the estimated total amount of expenditure at 13,226.5×100,000,000 KRW in 2012 (P-trend <0.001).
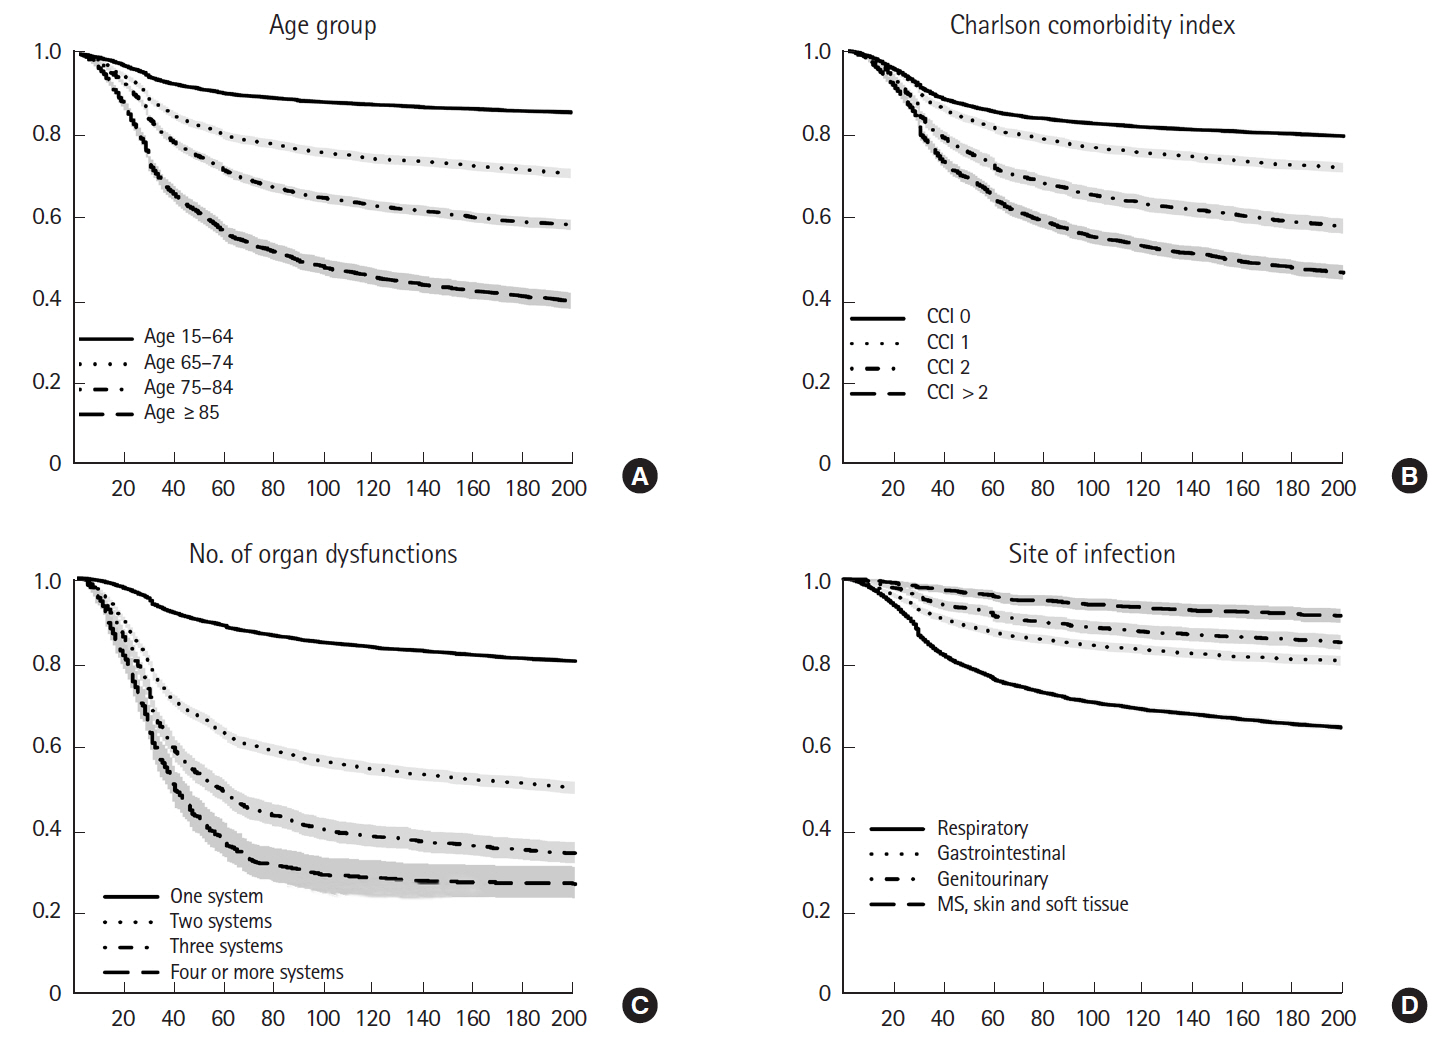
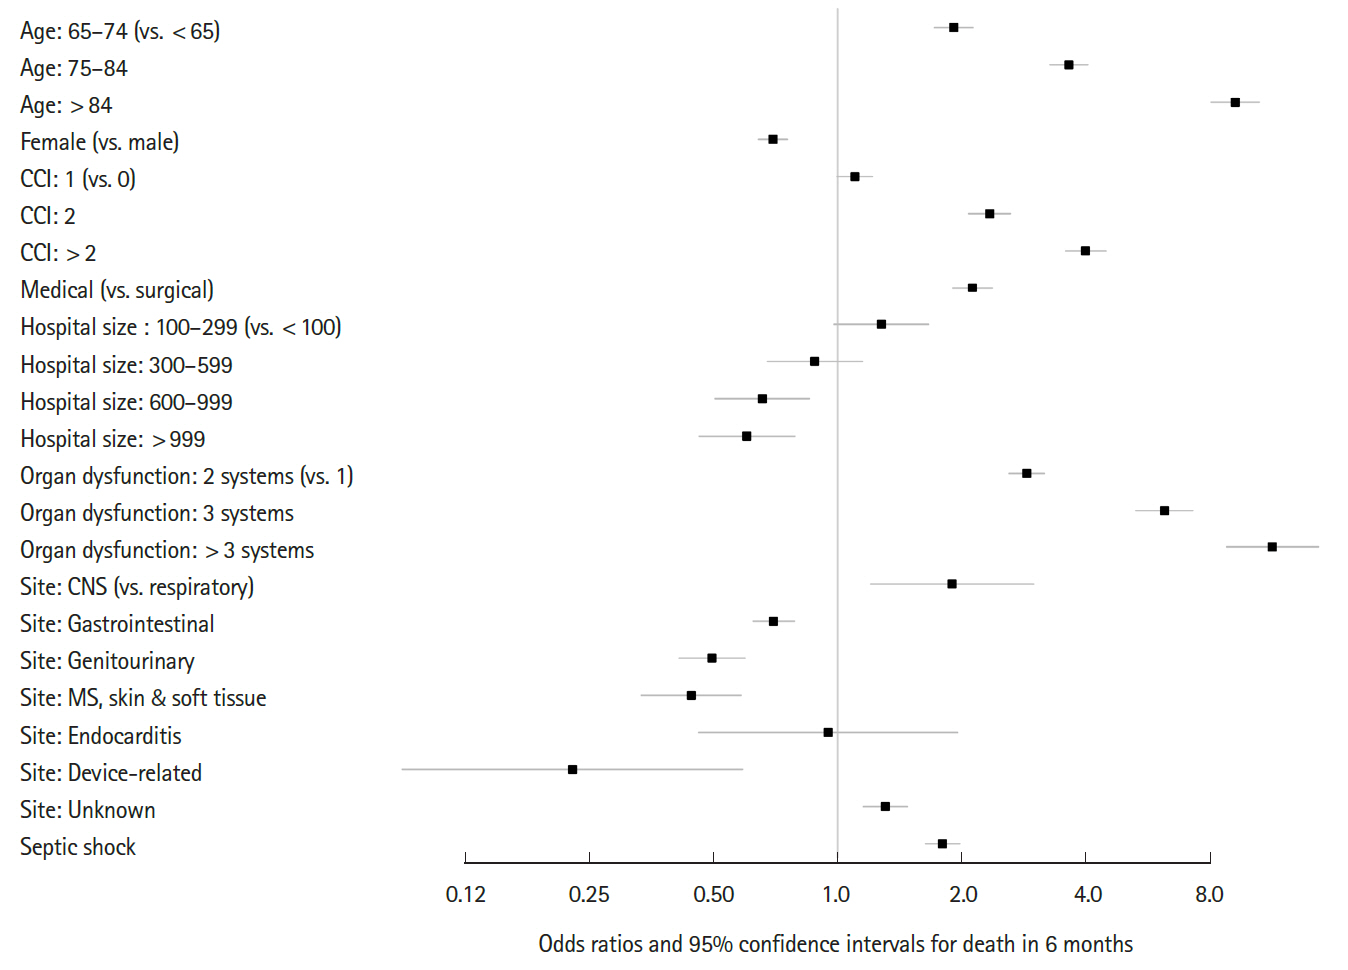
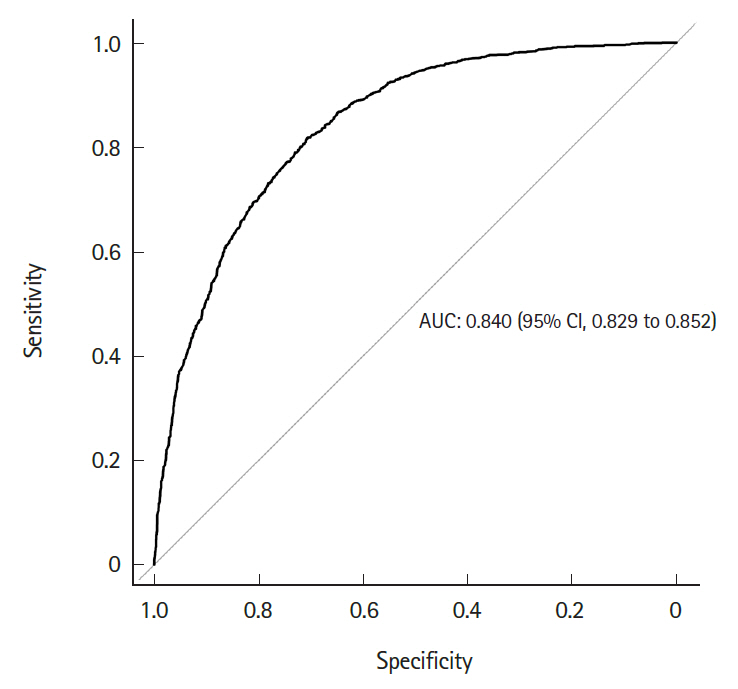
Fig. 4 shows the differential survival probabilities by age, comorbidity burden, organ dysfunction and site of infection. Older age, higher comorbidity burden, multiple organ dysfunction and primary respiratory infection were associated with higher mortality rates through the first 6 months (P<0.001 for all). To identify independent risk factors for 6-month mortality, we performed multivariable logistic regression using two different model-building schemes. The first, using all predictors and cases, showed that older age, higher comorbidity burden, ER presentation, admission to the medical department, multiple organ dysfunction, central nervous system or unspecified site of infection (vs. respiratory system), and the development of septic shock were independently associated with increased mortality (Table 2). In contrast, female sex; higher income level; larger hospital capacity; and gastrointestinal, genitourinary, musculoskeletal, skin and soft tissue and device-related infections were associated with lower mortality. The second model was developed using 80% of the data (training set) using Bayesian information criterion for variable selection showed similar results, with patient age, sex, comorbidity level, admitting department, hospital capacity, organ dysfunction, site of infection, and the development of septic shock identified as independent predictors (Table 3 and Fig. 5). Its performance in predicting the 6-month mortality was tested in the remaining 20% of data (test set) which yielded an area under the receiver operating characteristic curve of 0.840 (95% CI, 0.829 to 0.852) (Fig. 6).
DISCUSSION
This study is the first longitudinal, population-based study of sepsis in Korea. We found that sepsis is a relatively common condition with very high mortality in Korea as in other countries. Its overall incidence was increasing and the increase was most prominent in the old age and high comorbidity populations. This rapid increase among old and debilitated sepsis patients was accompanied by the overall increase in mortality. The increase in incidence rate and the cost per case were accompanied by more than a triple increase in national expenditure on sepsis. Considering that population aging is still an ongoing process in Korea, we believe these trends will continue for a while [26].
We found several interesting but worrisome risk factors for mortality from sepsis. The association between lower family income level and higher mortality can be the sign of disparities in the quality of critical care according to income levels. Although there was universal healthcare coverage by the National Health Insurance Service in Korea throughout the study period, there could be significant disparities in care as shown in previous studies of cardiovascular and cancer-related mortalities in the Korean population [27-29].
Another risk factor was smaller hospital capacity. It is possible that smaller hospitals have narrower ranges of available diagnostic tests and limited capacity for prompt source control which requires duty surgeons or interventional radiologists. It is also possible that the availability of critical care specialists and devices for the treatment of severe organ dysfunction (i.e., continuous renal replacement therapy equipment for acute kidney injury) could also be different. However, there has been no surveillance or any official report on the level of sepsis care provided by hospitals in Korea.
In this study, the age-sex-adjusted mortality rate was about 30%. This is consistent with the findings of previous population-based studies in which the mortality rate of ‘severe sepsis’ ranged from 26% to 40% [4,6,9,15,19,30-32]. However, these are clearly higher than the 10% mortality rate used to define ‘sepsis’ in the Sepsis-3 definition paper [1]. This difference could be due to methodological differences in identifying organ dysfunctions. Organ dysfunctions in population-based studies are identified based-on diagnostic and intervention codes. Because only significant clinical/laboratory derangements would lead to any entry of related diagnostic codes or application of interventions, organ dysfunctions identified in population-based studies must be more severe.
Lastly, the association between ER presentation and increased mortality could be an important finding. More than half of the patients received their initial care in the ER and their outcomes were worse than the other patients. Currently, we do not know whether this is due to the severity of diseases among ER patients or the quality of care provided in the ERs. However, we believe that the ER should be regarded as a critical intervention point for sepsis care as the ward and ICU have been, because the initial treatment of more than half of sepsis cases would be initiated in the ER and there might be a lot of room for improvement.
The coding scheme used in this study is unique in several aspects. First, the coding system was based on the ICD-10 in contrast to previous studies that were based on the ICD-9. Second, we used a more comprehensive set of diseases for case definition. Third, we limited the cases that were treated with intravenous antibiotics. Fourth, we applied several new operational definitions for organ dysfunction as described in the Appendix 1.
This study has several limitations. First, this study was based on claim data in which the accuracy of diagnostic codes was limited and significant over- or under-coding could be present. Second, it was impossible to accurately know the timing of clinical events. Although the sequence of events based on the order of the fragmented claim records of each admission case was considered, the sequence of events within each claim record was not available. Third, the operational definition used to define sepsis cases was arbitrary and could lead to possible misclassifications. Lastly, the overall cost and mortality rate were all-cause estimates. Therefore, it should be considered that a significant proportion of them would be attributable to non-sepsis conditions.
Despite these limitations, this study, as other population-based studies using claim data, allowed for the examination of health care utilization and expenditure of sepsis in a real-world setting of Korea. For the first time, it estimated the overall burden of sepsis and the overall trend in the epidemiology of sepsis in Korea using nationally representative cohort data. It also identified risk factors for death in sepsis some of which may have implications for our health care delivery system.
In conclusion, sepsis is relatively common and is associated with a high mortality rate in Korea. Although the current national burden of sepsis is already high, it is expected to increase at a fast pace because of the ongoing population aging in Korea. Proactive measures to curtail this increase in societal burden should be sought and implemented.
NOTES
Kyuseok Kim is an editorial board member of Clinical Experimental and Emergency Medicine; however, he did not involve in the paper reviewer selection, evaluation, and decision process of this article. Otherwise, no potential conflict of interest relevant to this article was reported.
ACKNOWLEDGMENTS
This study was supported by grant no. 17-2017-026 from the Seoul National University Bundang Hospital research fund. This study was also supported by grant no. 09-2015-001 from the Seoul National University Bundang Hospital research fund.
1. Singer M, Deutschman CS, Seymour CW, et al. The third international consensus definitions for sepsis and septic shock (Sepsis-3). JAMA 2016; 315:801-10.
2. Vincent JL, Marshall JC, Namendys-Silva SA, et al. Assessment of the worldwide burden of critical illness: the intensive care over nations (ICON) audit. Lancet Respir Med 2014; 2:380-6.
3. Rhodes A, Evans LE, Alhazzani W, et al. Surviving sepsis campaign: international guidelines for management of sepsis and septic shock: 2016. Intensive Care Med 2017; 43:304-77.
4. Martin GS, Mannino DM, Eaton S, Moss M. The epidemiology of sepsis in the United States from 1979 through 2000. N Engl J Med 2003; 348:1546-54.
5. Williams MD, Braun LA, Cooper LM, et al. Hospitalized cancer patients with severe sepsis: analysis of incidence, mortality, and associated costs of care. Crit Care 2004; 8:R291-8.
6. Ho BC, Bellomo R, McGain F, et al. The incidence and outcome of septic shock patients in the absence of early-goal directed therapy. Crit Care 2006; 10:R80.
7. Esper AM, Moss M, Lewis CA, Nisbet R, Mannino DM, Martin GS. The role of infection and comorbidity: factors that influence disparities in sepsis. Crit Care Med 2006; 34:2576-82.
8. Danai PA, Sinha S, Moss M, Haber MJ, Martin GS. Seasonal variation in the epidemiology of sepsis. Crit Care Med 2007; 35:410-5.
9. Dombrovskiy VY, Martin AA, Sunderram J, Paz HL. Rapid increase in hospitalization and mortality rates for severe sepsis in the United States: a trend analysis from 1993 to 2003. Crit Care Med 2007; 35:1244-50.
10. Wang HE, Shapiro NI, Angus DC, Yealy DM. National estimates of severe sepsis in United States emergency departments. Crit Care Med 2007; 35:1928-36.
11. Barnato AE, Alexander SL, Linde-Zwirble WT, Angus DC. Racial variation in the incidence, care, and outcomes of severe sepsis: analysis of population, patient, and hospital characteristics. Am J Respir Crit Care Med 2008; 177:279-84.
12. Vincent JL, Rello J, Marshall J, et al. International study of the prevalence and outcomes of infection in intensive care units. JAMA 2009; 302:2323-9.
13. Mayr FB, Yende S, Linde-Zwirble WT, et al. Infection rate and acute organ dysfunction risk as explanations for racial differences in severe sepsis. JAMA 2010; 303:2495-503.
14. Lagu T, Lindenauer PK, Rothberg MB, et al. Development and validation of a model that uses enhanced administrative data to predict mortality in patients with sepsis. Crit Care Med 2011; 39:2425-30.
15. Levy MM, Artigas A, Phillips GS, et al. Outcomes of the Surviving Sepsis Campaign in intensive care units in the USA and Europe: a prospective cohort study. Lancet Infect Dis 2012; 12:919-24.
16. Herring AA, Ginde AA, Fahimi J, et al. Increasing critical care admissions from U.S. emergency departments, 2001-2009. Crit Care Med 2013; 41:1197-204.
17. Villar J, Clement JP, Stotts J, et al. Many emergency department patients with severe sepsis and septic shock do not meet diagnostic criteria within 3 hours of arrival. Ann Emerg Med 2014; 64:48-54.
18. Stevenson EK, Rubenstein AR, Radin GT, Wiener RS, Walkey AJ. Two decades of mortality trends among patients with severe sepsis: a comparative meta-analysis. Crit Care Med 2014; 42:625-31.
19. Filbin MR, Arias SA, Camargo CA Jr, Barche A, Pallin DJ. Sepsis visits and antibiotic utilization in U.S. emergency departments. Crit Care Med 2014; 42:528-35.
20. Moore JX, Donnelly JP, Griffin R, Howard G, Safford MM, Wang HE. Defining sepsis mortality clusters in the United States. Crit Care Med 2016; 44:1380-7.
21. Lee J, Lee JS, Park SH, Shin SA, Kim K. Cohort profile: the National Health Insurance Service-National Sample Cohort (NHIS-NSC), South Korea. Int J Epidemiol 2017; 46:e15.
22. Quan H, Sundararajan V, Halfon P, et al. Coding algorithms for defining comorbidities in ICD-9-CM and ICD-10 administrative data. Med Care 2005; 43:1130-9.
23. Kim KH. Comparative study on three algorithms of the ICD-10 Charlson comorbidity index with myocardial infarction patients. J Prev Med Public Health 2010; 43:42-9.
24. Sharabiani MT, Aylin P, Bottle A. Systematic review of comorbidity indices for administrative data. Med Care 2012; 50:1109-18.
27. Song YM, Ferrer RL, Cho SI, Sung J, Ebrahim S, Davey Smith G. Socioeconomic status and cardiovascular disease among men: the Korean national health service prospective cohort study. Am J Public Health 2006; 96:152-9.
28. Kim CW, Lee SY, Moon OR. Inequalities in cancer incidence and mortality across income groups and policy implications in South Korea. Public Health 2008; 122:229-36.
29. Yim J, Hwang SS, Yoo KY, Kim CY. Contribution of income-related inequality and healthcare utilisation to survival in cancers of the lung, liver, stomach and colon. J Epidemiol Community Health 2012; 66:37-40.
30. Angus DC, Linde-Zwirble WT, Lidicker J, Clermont G, Carcillo J, Pinsky MR. Epidemiology of severe sepsis in the United States: analysis of incidence, outcome, and associated costs of care. Crit Care Med 2001; 29:1303-10.
31. Shen HN, Lu CL, Yang HH. Epidemiologic trend of severe sepsis in Taiwan from 1997 through 2006. Chest 2010; 138:298-304.
32. Fleischmann C, Scherag A, Adhikari NK, et al. Assessment of global incidence and mortality of hospital-treated sepsis. current estimates and limitations. Am J Respir Crit Care Med 2016; 193:259-72.
Fig. 1.
An illustration of the case identification and the assessment of variables. IV, intravenous; ICU, intensive care unit.
Fig. 2.
Eight-year trend of sepsis incidence and mortality. (A) Crude and adjusted incidence rate of sepsis. (B) Relative change of incidence of sepsis according to the age group. (C) Relative change of incidence of sepsis according to the comorbidity. (D) Crude and adjusted 6-month mortality of sepsis. CCI, Charlson comorbidity index.
Fig. 3.
Eight-year trend of national expenditure on sepsis. (A) Mean cost per case of sepsis. (B) Total national cost of sepsis. KRW, Korean won.
Fig. 4.
Differential survival probability by age, comorbidity burden, organ dysfunction, and the site of infection. (A) Survival according to the age group. (B) Survival according to the comorbidity. (C) Survival according to the number of organ dysfunction. (D) Survival according to the site of infection. CCI, Charlson comorbidity index; MS, musculoskeletal.
Fig. 5.
Predictors of the 6-month mortality model of sepsis. CCI, Charlson comorbidity index; CNS, central nervous system; MS, musculoskeletal.
Fig. 6.
Predictive performance of the 6-month mortality model of sepsis. AUC, area under the receiver operating characteristic curve; CI, confidence interval.
Table 1.
Patient characteristics of the study population
Characteristics
2005
2006
2007
2008
2009
2010
2011
2012
Total
P-value
No. of cases/person-year
2,194/825,502
2,256/820,204
2,398/842,444
2,672/832,170
2,921/837,177
2,887/846,853
3,639/855,428
3,915/863,820
22,882/6,723,598
Age group (yr)
<0.001
15–64
972 (44.3)
978 (43.4)
957 (39.9)
1,084 (40.6)
1,172 (40.1)
1,089 (37.7)
1,307 (35.9)
1,295 (33.1)
8,854 (38.7)
65–74
573 (26.1)
588 (26.1)
626 (26.1)
670 (25.1)
747 (25.6)
698 (24.2)
818 (22.5)
901 (23.0)
5,621 (24.6)
75–84
499 (22.7)
522 (23.1)
614 (25.6)
658 (24.6)
726 (24.9)
793 (27.5)
1,037 (28.5)
1,207 (30.8)
6,056 (26.5)
≥ 85
150 (6.8)
168 (7.4)
201 (8.4)
260 (9.7)
276 (9.4)
307 (10.6)
477 (13.1)
512 (13.1)
2,351 (10.3)
Sex, male
1,273 (58.0)
1,239 (54.9)
1,352 (56.4)
1,519 (56.8)
1,622 (55.5)
1,654 (57.3)
1,948 (53.5)
2,112 (53.9)
12,719 (55.6)
0.003
Comorbidities
Chronic pulmonary disease
473 (21.6)
500 (22.2)
505 (21.1)
585 (21.9)
636 (21.8)
600 (20.8)
723 (19.9)
811 (20.7)
4,833 (21.1)
0.384
Neoplasm
230 (10.5)
246 (10.9)
249 (10.4)
297 (11.1)
289 (9.9)
281 (9.7)
378 (10.4)
453 (11.6)
2,423 (10.6)
0.251
Chronic liver disease
151 (6.9)
119 (5.3)
144 (6.0)
163 (6.1)
207 (7.1)
162 (5.6)
202 (5.6)
234 (6.0)
1,382 (6.0)
0.067
Renal disease
55 (2.5)
49 (2.2)
74 (3.1)
94 (3.5)
105 (3.6)
90 (3.1)
151 (4.1)
198 (5.1)
816 (3.6)
< 0.001
Diabetes melitus
173 (7.9)
193 (8.6)
246 (10.3)
287 (10.7)
322 (11.0)
342 (11.8)
410 (11.3)
554 (14.2)
2,527 (11.0)
< 0.001
Peripheral vascular disease
31 (1.4)
30 (1.3)
34 (1.4)
40 (1.5)
46 (1.6)
57 (2.0)
62 (1.7)
89 (2.3)
389 (1.7)
0.051
Rheumatological disease
8 (0.4)
24 (1.1)
12 (0.5)
16 (0.6)
16 (0.5)
28 (1.0)
22 (0.6)
32 (0.8)
158 (0.7)
0.036
Charlson comorbidity index
< 0.001
0
1,170 (53.3)
1,160 (51.4)
1,224 (51.0)
1,318 (49.3)
1,420 (48.6)
1,419 (49.2)
1,783 (49.0)
1,773 (45.3)
11,267 (49.2)
1
544 (24.8)
584 (25.9)
580 (24.2)
613 (22.9)
739 (25.3)
723 (25.0)
880 (24.2)
940 (24.0)
5,603 (24.5)
2
220 (10.0)
246 (10.9)
285 (11.9)
347 (13.0)
361 (12.4)
372 (12.9)
487 (13.4)
539 (13.8)
2,857 (12.5)
>2
260 (11.9)
266 (11.8)
309 (12.9)
394 (14.7)
401 (13.7)
373 (12.9)
489 (13.4)
663 (16.9)
3,155 (13.8)
Presented to emergency room
1,274 (58.1)
1,329 (58.9)
1,425 (59.4)
1,492 (55.8)
1,618 (55.4)
1,658 (57.4)
2,070 (56.9)
2,262 (57.8)
13,128 (57.4)
0.041
Medical department
1,520 (69.3)
1,560 (69.1)
1,686 (70.3)
1,884 (70.5)
2,059 (70.5)
2,018 (69.9)
2,630 (72.3)
2,855 (72.9)
16,212 (70.9)
0.007
Surgical department
668 (30.4)
694 (30.8)
708 (29.5)
782 (29.3)
855 (29.3)
865 (30.0)
1,002 (27.5)
1,053 (26.9)
6,627 (29.0)
0.006
Income level
< 0.001
Lower
376 (17.1)
324 (14.4)
398 (16.6)
502 (18.8)
518 (17.7)
446 (15.4)
1,064 (29.2)
1,102 (28.1)
4,730 (20.7)
Lower-middle
326 (14.9)
323 (14.3)
332 (13.8)
344 (12.9)
398 (13.6)
415 (14.4)
392 (10.8)
432 (11.0)
2,962 (12.9)
Middle
372 (17.0)
387 (17.2)
422 (17.6)
492 (18.4)
509 (17.4)
490 (17.0)
496 (13.6)
472 (12.1)
3,640 (15.9)
Upper-middle
475 (21.6)
490 (21.7)
516 (21.5)
533 (19.9)
594 (20.3)
547 (18.9)
619 (17.0)
670 (17.1)
4,444 (19.4)
Upper
645 (29.4)
732 (32.4)
730 (30.4)
801 (30.0)
902 (30.9)
989 (34.3)
1,068 (29.3)
1,239 (31.6)
7,106 (31.1)
Hospital size (no. of beds)
< 0.001
< 100
59 (2.7)
75 (3.3)
59 (2.5)
89 (3.3)
98 (3.4)
100 (3.5)
74 (2.0)
72 (1.8)
626 (2.7)
100–299
399 (18.2)
417 (18.5)
451 (18.8)
531 (19.9)
580 (19.9)
650 (22.5)
808 (22.2)
801 (20.5)
4,637 (20.3)
300–599
501 (22.8)
418 (18.5)
528 (22.0)
585 (21.9)
618 (21.2)
650 (22.5)
889 (24.4)
971 (24.8)
5,160 (22.6)
600–999
645 (29.4)
668 (29.6)
739 (30.8)
779 (29.2)
856 (29.3)
813 (28.2)
1,002 (27.5)
1,136 (29.0)
6,638 (29.0)
≥ 1,000
590 (26.9)
678 (30.1)
621 (25.9)
688 (25.7)
769 (26.3)
674 (23.3)
866 (23.8)
935 (23.9)
5,821 (25.4)
Organ dysfunction
Respiratory
1,163 (53.0)
1,172 (52.0)
1,286 (53.6)
1,400 (52.4)
1,482 (50.7)
1,459 (50.5)
1,851 (50.9)
2,041 (52.1)
11,854 (51.8)
0.218
Hemodynamic
1,024 (46.7)
1,075 (47.7)
1,160 (48.4)
1,251 (46.8)
1,393 (47.7)
1,359 (47.1)
1,731 (47.6)
1,799 (46.0)
10,792 (47.2)
0.679
Sepsis-induced cardiomyopathy
5 (0.2)
7 (0.3)
11 (0.5)
10 (0.4)
20 (0.7)
18 (0.6)
25 (0.7)
46 (1.2)
142 (0.6)
< 0.001
Hematologic
266 (12.1)
231 (10.2)
257 (10.7)
275 (10.3)
309 (10.6)
299 (10.4)
356 (9.8)
391 (10.0)
2,384 (10.4)
0.210
Renal
261 (11.9)
301 (13.3)
303 (12.6)
327 (12.2)
363 (12.4)
374 (13.0)
479 (13.2)
584 (14.9)
2,992 (13.1)
0.013
Hepatic
198 (9.0)
167 (7.4)
176 (7.3)
230 (8.6)
206 (7.1)
188 (6.5)
194 (5.3)
159 (4.1)
1,518 (6.6)
< 0.001
Metabolic
29 (1.3)
27 (1.2)
37 (1.5)
39 (1.5)
33 (1.1)
37 (1.3)
61 (1.7)
65 (1.7)
328 (1.4)
0.469
Neurologic
115 (5.2)
121 (5.4)
130 (5.4)
179 (6.7)
180 (6.2)
182 (6.3)
275 (7.6)
331 (8.5)
1,513 (6.6)
< 0.001
No. of organ dysfunctions
0.351
1
1,585 (72.2)
1,651 (73.2)
1,701 (70.9)
1,962 (73.4)
2,138 (73.2)
2,147 (74.4)
2,670 (73.4)
2,846 (72.7)
16,700 (73.0)
2
420 (19.1)
423 (18.8)
495 (20.6)
481 (18.0)
559 (19.1)
519 (18.0)
699 (19.2)
747 (19.1)
4,343 (19.0)
3
134 (6.1)
132 (5.9)
152 (6.3)
152 (5.7)
173 (5.9)
163 (5.6)
193 (5.3)
229 (5.8)
1,328 (5.8)
≥4
55 (2.5)
50 (2.2)
50 (2.1)
77 (2.9)
51 (1.7)
58 (2.0)
77 (2.1)
93 (2.4)
511 (2.2)
Site of infection
0.001
Respiratory
1,122 (51.1)
1,189 (52.7)
1,307 (54.5)
1,431 (53.6)
1,529 (52.3)
1,559 (54.0)
1,951 (53.6)
2,167 (55.4)
12,255 (53.6)
CNS
14 (0.6)
19 (0.8)
20 (0.8)
12 (0.4)
18 (0.6)
30 (1.0)
18 (0.5)
19 (0.5)
150 (0.7)
Gastrointestinal
444 (20.2)
445 (19.7)
441 (18.4)
508 (19.0)
570 (19.5)
541 (18.7)
714 (19.6)
720 (18.4)
4,383 (19.2)
Genitourinary
122 (5.6)
147 (6.5)
183 (7.6)
188 (7.0)
202 (6.9)
218 (7.6)
259 (7.1)
310 (7.9)
1,629 (7.1)
Musculoskeletal, skin and soft tissue 114 (5.2)
87 (3.9)
99 (4.1)
130 (4.9)
154 (5.3)
146 (5.1)
164 (4.5)
174 (4.4)
1,068 (4.7)
Endocarditis
5 (0.2)
7 (0.3)
4 (0.2)
9 (0.3)
8 (0.3)
8 (0.3)
11 (0.3)
11 (0.3)
63 (0.3)
Device-related
16 (0.7)
5 (0.2)
9 (0.4)
14 (0.5)
12 (0.4)
7 (0.2)
15 (0.4)
24 (0.6)
102 (0.4)
Unspecified
357 (16.3)
357 (15.8)
335 (14.0)
380 (14.2)
428 (14.7)
378 (13.1)
507 (13.9)
490 (12.5)
3,232 (14.1)
Septic shock
1,014 (46.2)
1,063 (47.1)
1,146 (47.8)
1,227 (45.9)
1,367 (46.8)
1,320 (45.7)
1,694 (46.6)
1,739 (44.4)
10,570 (46.2)
0.242
Length of stay
Median (IQR)
12.0 (7.0-24.0)
13.0 (7.0-26.0)
14.0 (7.0-26.0)
13.0 (7.0-27.0)
12.0 (7.0-25.0)
13.0 (7.0-26.0)
13.0 (7.0-28.0)
14.0 (7.0-29.0)
13.0 (7.0-26.0)
< 0.001
Mean ± SD
24.7 ± 44.5
27.0 ± 48.3
26.6 ± 43.1
27.3 ± 48.8
25.6 ± 47.2
29.2 ± 55.4
32.5 ± 62.3
36.3 ± 69.7
29.3 ± 55.0
Cost (10,000 KRW)
Median (IQR)
209.8 (113.9-449.5)
240.5 (131.1-539.8)
283.5 (144.8-604.8)
263.8 (140.6-633.2)
264.8 (144.3-617.5)
292.6 (151.2-645.9)
306.3 (158.0-675.1)
309.9 (163.1-731.5)
276 (144.2-621.8)
< 0.001
Mean ± SD
425.3 ± 628.1
513.9 ± 804.3
548.6 ± 801.2
574.2 ± 959.5
593.9 ± 951.3
620.2 ± 1,002.5
681.2 ± 1,079.9
743.3 ± 1,226.6
605.6 ± 984.8
ICU admission
747 (34.0)
722 (32.0)
806 (33.6)
792 (29.6)
896 (30.7)
821 (28.4)
1,139 (31.3)
1,208 (30.9)
7,131 (31.2)
< 0.001
6-month mortality
582 (26.5)
628 (27.8)
696 (29.0)
790 (29.6)
831 (28.4)
881 (30.5)
1,089 (29.9)
1,243 (31.7)
6,740 (29.5)
0.001
Values are presented as number (%) unless otherwise indicated.
CNS, central nervous system; IQR, interquartile range; SD, standard deviation; KRW, Korean won; ICU, intensive care unit.
Table 2.
Multivariable logistic regression model for 6-month mortality
Characteristics
OR
95% CI
P-value
Year
2006 (vs. 2005)
1.10
0.94–1.29
0.234
2007
1.04
0.89–1.22
0.589
2008
1.05
0.90–1.22
0.511
2009
1.01
0.87–1.18
0.851
2010
1.10
0.95–1.28
0.208
2011
0.97
0.84–1.11
0.631
2012
1.00
0.87–1.15
0.998
Age (yr)
65–74 (vs. <65)
1.95
1.77–2.15
< 0.001
75–84
3.68
3.34–4.05
< 0.001
≥ 85
9.25
8.18–10.45
< 0.001
Sex, female
0.70
0.66–0.76
< 0.001
Charlson comorbidity index
1 (vs. 0)
1.08
0.98–1.18
0.104
2 (vs. 0)
2.39
2.16–2.65
< 0.001
> 2 (vs. 0)
4.22
3.81–4.66
< 0.001
ER visit (vs. all other presentation)
1.12
1.03–1.21
0.005
Medical departments (vs. all others)
2.09
1.89–2.31
< 0.001
Income level
Lower-middle (vs. lower)
1.04
0.92–1.17
0.563
Middle
1.01
0.90–1.13
0.904
Upper-middle
0.92
0.82–1.02
0.115
Upper
0.85
0.77–0.94
0.001
Hospital size (beds)
100–299 (vs. <100)
1.12
0.89–1.42
0.329
300–599
0.75
0.59–0.96
0.019
600–999
0.55
0.43–0.69
< 0.001
≥ 1,000
0.51
0.40–0.65
< 0.001
No. of organ dysfunctions
2 (vs. 1)
2.90
2.65–3.17
< 0.001
3
6.30
5.45–7.28
< 0.001
≥4
10.28
8.18–12.91
< 0.001
Site of infection
CNS (vs. respiratory)
1.69
1.12–2.55
0.012
Gastrointestinal
0.69
0.62–0.77
< 0.001
Genitourinary
0.48
0.41–0.57
< 0.001
Musculoskeletal, skin & soft tissue
0.47
0.37–0.60
< 0.001
Endocarditis
0.93
0.48–1.79
0.829
Device-related
0.19
0.07–0.47
< 0.001
Unspecified
1.30
1.17–1.46
< 0.001
Septic shock (vs. no septic shock)
1.79
1.64–1.95
< 0.001
OR, odds ratio; CI, confidence interval; ER, emergency room; CNS, central nervous system.
Table 3.
Parsimonious multivariable logistic regression model derived from training set
Characteristics
OR
95% CI
P-value
Age (yr)
65–74 (vs. <65)
1.91
1.71–2.12
< 0.001
75–84
3.63
3.27–4.02
< 0.001
≥ 85
9.16
8.01–10.48
< 0.001
Sex, female
0.70
0.64–0.76
< 0.001
Charlson comorbidity index
1 (vs. 0)
1.10
1.00–1.21
0.058
2 (vs. 0)
2.33
2.08–2.62
< 0.001
> 2 (vs. 0)
3.98
3.56–4.45
< 0.001
Medical departments (vs. all others)
2.12
1.90–2.37
< 0.001
Hospital size (beds)
100–299 (vs. <100)
1.28
0.98–1.66
0.070
300–599
0.88
0.68–1.15
0.346
600–999
0.66
0.51–0.86
0.002
≥ 1,000
0.60
0.46–0.79
< 0.001
No. of organ dysfunctions
2 (vs. 1)
2.87
2.60–3.17
< 0.001
3
6.17
5.27–7.23
< 0.001
≥4
11.28
8.73–14.58
< 0.001
Site of infection
CNS (vs. respiratory)
1.89
1.20–2.98
0.006
Gastrointestinal
0.70
0.62–0.78
< 0.001
Genitourinary
0.50
0.41–0.60
< 0.001
Musculoskeletal, skin & soft tissue
0.44
0.34–0.58
< 0.001
Endocarditis
0.95
0.46–1.95
0.884
Device-related
0.23
0.09–0.59
0.002
Unspecified
1.30
1.15–1.47
< 0.001
Septic shock (vs. no septic shock)
1.79
1.63–1.97
< 0.001
OR, odds ratio; CI, confidence interval; CNS, central nervous system.