| Home | E-Submission | Sitemap | Contact Us |  
Search
Clin Exp Emerg Med Search

CLOSE

Clin Exp Emerg Med > Volume 6(2); 2019 > Article
Gang, Hong, Shin, Song, Ro, Kim, Park, and Jeong: New prehospital scoring system for traumatic brain injury to predict mortality and severe disability using motor Glasgow Coma Scale, hypotension, and hypoxia: a nationwide observational study

Abstract

Objective

Assessing the severity of injury and predicting outcomes are essential in traumatic brain injury (TBI). However, the respiratory rate and Glasgow Coma Scale (GCS) of the Revised Trauma Score (RTS) are difficult to use in the prehospital setting. This investigation aimed to develop a new prehospital trauma score for TBI (NTS-TBI) to predict mortality and disability.

Methods

We used a nationwide trauma database on severe trauma cases transported by fire departments across Korea in 2013 and 2015. NTS-TBI model 1 used systolic blood pressure <90 mmHg, peripheral capillary oxygen saturation <90% measured via pulse oximeter, and motor component of GCS. Model 2 comprised variables of model 1 and age >65 years. We assessed discriminative power via area under the curve (AUC) value for in-hospital mortality and disability defined according to the Glasgow Outcome Scale with scores of 2 or 3. We then compared AUC values of NTS-TBI with those of RTS.

Results

In total, 3,642 patients were enrolled. AUC values of NTS-TBI models 1 and 2 for mortality were 0.833 (95% confidence interval [CI], 0.815 to 0.852) and 0.852 (95% CI, 0.835 to 0.869), respectively, while AUC values for disability were 0.772 (95% CI, 0.749 to 0.796) and 0.784 (95% CI, 0.761 to 0.807), respectively. AUC values of NTS-TBI model 2 for mortality and disability were higher than those of RTS (0.819 and 0.761, respectively) (P<0.01).

Conclusion

Our NTS-TBI model using systolic blood pressure, motor component of GCS, oxygen saturation, and age was feasible for prehospital care and showed outstanding discriminative power for mortality.

INTRODUCTION

Traumatic brain injury (TBI) is among the major causes of mortality and disability worldwide [1]. In the United States, approximately 1.7 million patients with TBI were taken to the emergency department annually, and 52,000 patients died [2]. Moreover, 5.3 million patients have TBI-associated disability, which results in a socioeconomic burden [3-9].
Assessing injury severity and swift transport of the patient to the designated trauma center are essential to reduce the mortality in patients with severe trauma [10]. The mortality rate increased by two-fold when a patient with moderate to severe TBI was not transported to the designated trauma center according to prehospital field triage [11]. Therefore, measuring the injury severity and predicting the clinical outcome of TBI patients are critical to reduce secondary insult and improve outcome.
There are scoring systems to assess injury severity and predict outcome for TBI patients [12,13], but most include variables that are not commonly available in the routine prehospital setting, such as CT findings or laboratory results [12,14,15]. Recent studies reported that prehospital hypoxia and hypotension in patients with TBI increased mortality [16-19]; thus, systolic blood pressure (SBP) is a feasible indicator of mortality during the prehospital phase, and oxygen saturation measured via pulse oximeter is more objective and feasible than the respiratory rate (RR) included in the Revised Trauma Score (RTS) [20-24]. The Glasgow Coma Scale (GCS) is a practical method for assessing neurologic function, and the predictive power of the motor component of the GCS (motor GCS) is equivalent to that of the total GCS [25,26], which is used as a physiologic indicator in field triage [27,28].
This study aimed to develop a new trauma score optimized for prehospital care patients with TBI (NTS-TBI) to predict mortality and disability using motor GCS, hypotension, and hypoxia instead of total GCS, SBP, and RR of the RTS.

METHODS

Study design and setting

This was a retrospective, cross-sectional study that used an emergency medical services (EMS)-based severe trauma database operated by the Korea Center for Disease Control (KCDC) across South Korea. This study was approved by the study site’s institutional review board and the KCDC (H-1206-024-412). Informed consent was waived due to the retrospective nature of the study.
In South Korea, the EMS system is a nationwide public and single-tiered model operated by the fire department. Emergency departments are categorized into three levels: level 1, regional emergency medical center; level 2, local emergency medical center; and level 3, institutions not designated as regional or local emergency center across Korea [29]. Each province has designated regional trauma centers that are similar to level 1 trauma centers in the United States. Prehospital trauma care is provided by intermediate emergency medical technicians (EMT). EMTs used the field triage scheme to assess injury severity and transport patients to the designated facility. The field triage scheme used in Korea is similar to that developed by the Centers for Disease Control and Prevention in the United States [28].

Data source

The EMS-based severe trauma database (EMS-ST-DB) is a data source operated by the KCDC. Every case transported by the fire department categorized as a severe trauma case according to the field triage scheme is registered in the EMS-ST-DB.
The database collects prehospital information from the EMS run-sheets and in-depth severe trauma registry written by the EMTs of the fire department. Experienced medical record reviewers trained by the KCDC then visit the hospital receiving the severe trauma cases and collect in-hospital information and input final outcomes in the EMS-ST-DB. In 2013, the EMS-ST-DB collected information on cases from 10 provinces across Korea and expanded to all 17 provinces across Korea thereafter.
For quality improvement, a project quality management committee in the KCDC holds monthly meetings. This committee consisted of emergency physicians, epidemiologists, statistical experts, fire department representatives, and medical record reviewers. The quality management committee established the standard operational protocols for extracting data from the medical records and provided consultation and feedback to the medical record reviewers.

Study population

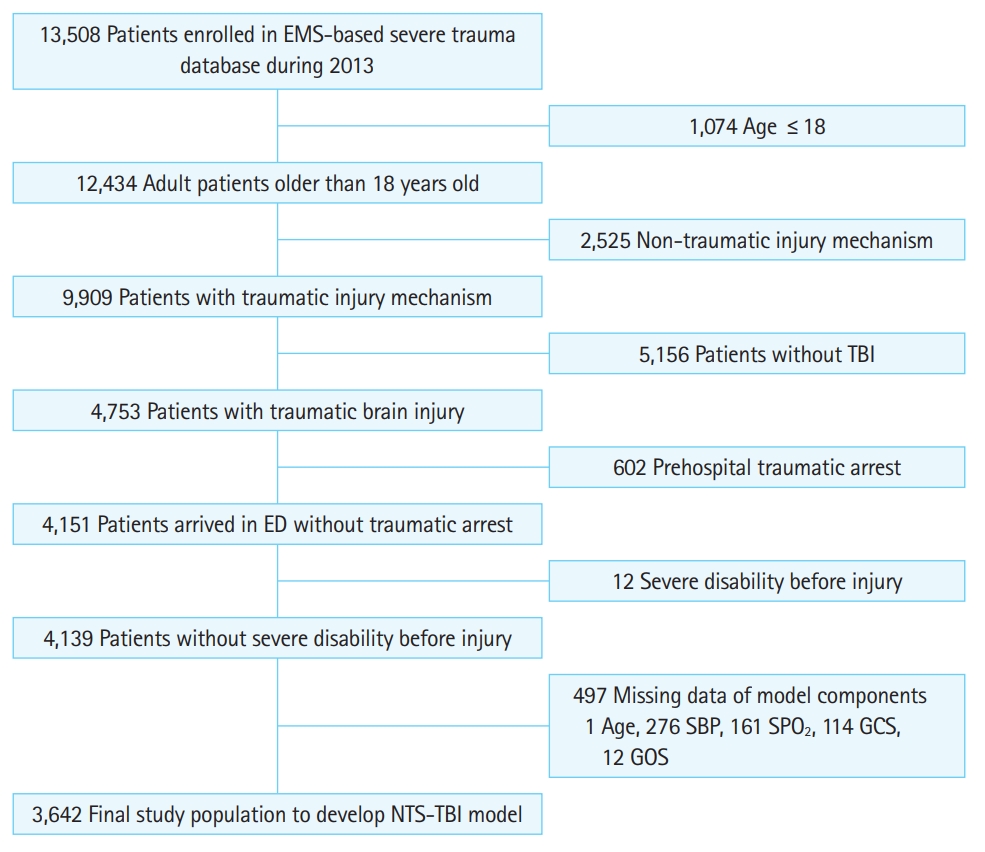
Among those enrolled in the EMS-ST-DB in 2013 and 2015, patients older than 18 years with TBI were included in the study. TBI was defined as a head injury according to the Abbreviated Injury Scale. The Abbreviated Injury Scale is a scoring system to measure the severity of injury for six body parts independently and is used for calculating Injury Severity Score [30]. We excluded patients who had prehospital traumatic arrest or those with non-traumatic injury. The exclusion criteria were as follows: (1) severe disability before the accident; (2) unknown or missing information on the variables in the NTS-TBI model, including SBP, RR, motor GCS, and age; and (3) a Glasgow Outcome Scale (GOS) of 2 or 3 before the injury. Briefly, the GOS is a global scale used to assess functional outcome; the score ranges from 1 to 5, with 1 indicating dead; 2, vegetative state; 3, severely disabled, dependent for daily support due to mental or physical disability, or both; 4, moderately disabled, able to work in a sheltered environment, and travel by public transportation; and 5, good recovery, resumption of normal life.

Model development and validation

We developed two NTS-TBI models using data from the EMS-ST-DB collected from 10 provinces in 2013. The first model of the NTS-TBI (NTS-TBI model 1) comprised motor GCS score, presence of shock defined as SBP <90 mmHg, and presence of hypoxia defined as oxygen saturation below 90% measured on pulse oximeter on initial assessment at the scene [17,31]. The second version of the NTS-TBI (NTS-TBI model 2) included all variables in model 1 and age older than 65 years. Old age was used in the second model as the elderly have been shown to have poor outcomes in previous research [13]. The cut-off for old age was set to ≥65 years based on the World Health Organization definition of the elderly [32].
We internally validated the predictive performance of NTS-TBI models 1 and 2 using the original data set used for model development. External validation was conducted using the EMS-ST-DB data collected from all 17 provinces in 2015.

Outcomes

The primary outcome was the predictive power of the NTS-TBI for in-hospital mortality, while the secondary outcome was the discriminative power of the model to predict severe disability at hospital discharge. Severe disability was defined as GOS score of 2 or 3 at hospital discharge. Cases with GOS score of 1 were excluded in the analysis of severe disability.

Comparison of the performance of the NTS-TBI and RTS

We compared the discriminative power for mortality and disability between the RTS and NTS-TBI models using the following equation: RTS=(0.9368×GCS score category)+(0.7326×SBP)+(0.2908 ×RR) [27]. The variables of RTS included in the equation were those measured by EMTs upon first contact with the patient at the field.

Statistical analysis

We performed descriptive analysis for demographic characteristics. Quantitative variables were reported as mean with standard deviation or median with interquartile range, and categorical variables were reported as number and percentage. We conducted the chi-square test of Fisher exact test for categorical variables and the t-test for continuous variables. To assess the predictive power of each model, we measured the area under the receiver operating characteristic curve and 95% confidence interval of each model. To compare the performance of the NTS-TBI and RTS, we compared the AUC value of each model and measured the significance of difference. Significance was set at P-values of 0.01, and all statistical analyses were performed using SAS ver. 9.4 (SAS Institute, Cary, NC, USA).

RESULTS

There were 13,508 cases enrolled in the EMS-ST-DB during the study period; of these, 3,642 cases were included for model development and internal validation according to the inclusion criteria (Fig. 1). A total of 426 (11.7%) of the 3,642 cases died, and 452 cases had severe disability (Table 1). Mortality was higher in urban areas, during daytime, and in level 1 emergency departments. Mortality was also higher in the shock group than that in the non-shock group (28.2% vs. 10.5%, P<0.01) (Table 2) and in the hypoxia group than that in the non-hypoxia group (36.0% vs. 9.3%, P<0.01). The incidence of severe disability was also higher in the shock and hypoxia groups.
We assessed the discriminative power of NTS-TBI models 1 and 2 by using the original data set (Table 3). The AUC value of NTS-TBI models 1 and 2 for in-hospital mortality was 0.833 (95% CI, 0.815 to 0.852) and 0.852 (95% CI, 0.835 to 0.869), respectively. The AUC of NTS-TBI models 1 and 2 for predicting severe disability was also higher than 0.75, indicating that the NTS-TBI model showed excellent performance in predicting outcome.
We also conducted an external validation by analyzing 4,497 of the 32,841 cases registered in the EMS-ST-DB from 17 provinces in 2015 (Table 4). The AUC value of NTS-TBI models 1 and 2 for in-hospital mortality was 0.779 (95% CI, 0.762 to 0.800) and 0.802 (95% CI, 0.786 to 0.828), respectively. The AUC for NTS-TBI models 1 and 2 to predict severe disability was also higher than 0.7, indicating that the NTS-TBI model showed good performance in predicting outcome.
We compared the predictive power of the NTS-TBI and RTS for mortality and severe disability (Table 5). The discriminative power of the NTS-TBI models 1 and 2 for mortality were 0.833 and 0.852, respectively, and they were significantly higher than that of the RTS (P<0.01). The AUC of the NTS-TBI models 1 and 2 for predicting severe disability was 0.772 and 0.784, respectively. NTS-TBI model 2 showed significantly better performance than that of RTS (AUC, 0.761) (P<0.01).

DISCUSSION

We developed a new scoring system to predict the clinical outcome for TBI patients and optimized it to be implemented in the prehospital care. We used motor GCS scores and oxygen saturation values obtained via pulse oximeter instead of total GCS score and RR used in the RTS. Motor GCS and oxygen saturation measured by pulse oximeter could be easily and objectively integrated into prehospital care. We developed two versions of the NTS-TBI model using the nationwide trauma registry operated by the KCDC. Both NTS-TBI models showed excellent performance as a predictor for mortality and good power for predicting severe disability in TBI patients. The discriminative power of NTS-TBI was significantly higher than that of RTS.
RTS has been used to predict outcomes for trauma patients, and the components of RTS are included in the first step of assessment in the field triage scheme [27,28,33]. However, some variables in the RTS are not easily available in the field. Thus, to improve ease of use and discriminative power, we developed an NTS-TBI. First, we replaced the GCS with the motor GCS, which has been shown to have a predictive power equivalent to that of total GCS in previous research. Moreover, the logistic model showed a more linear relationship with the outcome [25,26]. Second, hypoxia or hypotension during prehospital transport was included in the models as they have been shown to cause worse clinical outcomes such as mortality in recent studies [16-19]. Hypotension before emergency department arrival has a linear correlation with mortality [16]. Prehospital hypotension in TBI patients causes a 2.5-fold increase in mortality, and hypoxia results in a 3.0-fold increase. If combined, hypoxia and hypotension increased the risk of mortality by 6.1-fold [17]. Thus, assessing hypoxia and hypotension is essential during prehospital care to predict outcome. Third, RR has been used as a physiologic indicator to assess the severity of trauma. Given that it is difficult to measure the RR accurately in the prehospital stage [34,35], the pulse oximeter has been used as an objective tool to measure hypoxic status in diverse clinical settings [22-24], oxygen saturation reflects the patient’s respiratory function more objectively and efficiently [20,21]. The NTS-TBI included oxygen saturation instead of RR so that it can obtain more objective data and be used easily in the prehospital setting.
We reviewed diverse parameters for NTS-TBI. Age, GCS, RR, pupillary reactivity, hypotension, hypoxia, Injury Severity Score, injury mechanism, computed tomography images, and laboratory findings have been used to develop a trauma scoring system for TBI patients [12,13,15,36-39]. However, the Injury Severity Score, computed tomography images, and laboratory findings are not routinely available in the prehospital phase; thus, we developed a model that included variables that can be easily but objectively assessed during this phase.
This study has several limitations. First, the generalizability of the results is limited. Because we used data only from the EMS-ST-DB in Korea, and different trauma care systems vary among countries and could affect the performance of NTS-TBI. Second, there are inherent biases that may not have been eliminated due to the retrospective nature of the study. We retrospectively reviewed the medical records of each hospital and EMS run-sheet. Although we performed regular quality assessment, the quality of the raw medical record depends on each institution. Third, the variables in the NTS-TBI were limited to those in the EMS-ST-DB. For example, pupillary reactivity was not included and tested for model development.
In conclusion, the new trauma scoring system we developed to predict outcomes for TBI patients showed excellent performance to predict mortality. The NTS-TBI included variables that can be easily and objectively assessed in the pre-hospital setting, namely, motor GCS, hypoxia assessed using a pulse oximeter, shock, and age.

NOTES

No potential conflict of interest relevant to this article was reported.

ACKNOWLEDGMENTS

This study was supported by the Korea Centers for Disease Control and Prevention.

REFERENCES

1. Coronado VG, Xu L, Basavaraju SV, et al. Surveillance for traumatic brain injury-related deaths: United States, 1997-2007. MMWR Surveill Summ 2011; 60:1-32.

2. Coronado VG, McGuire LC, Sarmiento K, et al. Trends in traumatic brain injury in the U.S. and the public health response: 1995-2009. J Safety Res 2012; 43:299-307.
crossref pmid
3. Faul M, Xu L, Wald MM, Coronado VG. Traumatic brain injury in the United States. Atlanta, GA: Centers for Disease Control and Prevention; 2010.

4. Roden-Foreman K, Solis J, Jones A, et al. Prospective evaluation of posttraumatic stress disorder and depression in orthopaedic injury patients with and without concomitant traumatic brain injury. J Orthop Trauma 2017; 31:e275-80.
crossref pmid
5. Ahmed MM, Besser LM, Galasko DR, Salmon DP, Kukull WA. Traumatic brain injury (TBI) and dementia progression. Alzheimer Dement J Alzheimer Assoc 2016; 12:P703-4.
crossref
6. Gardner RC, Burke JF, Nettiksimmons J, Kaup A, Barnes DE, Yaffe K. Dementia risk after traumatic brain injury vs nonbrain trauma: the role of age and severity. JAMA Neurol 2014; 71:1490-7.
crossref pmid pmc
7. Rutland-Brown W, Langlois JA, Thomas KE, Xi YL. Incidence of traumatic brain injury in the United States, 2003. J Head Trauma Rehabil 2006; 21:544-8.
crossref pmid
8. Finkelstein EA, Corso PS, Miller TR. Incidence and economic burden of injuries in the United States. Oxford: Oxford University Press; 2006.

9. Selassie AW, Zaloshnja E, Langlois JA, Miller T, Jones P, Steiner C. Incidence of long-term disability following traumatic brain injury hospitalization, United States, 2003. J Head Trauma Rehabil 2008; 23:123-31.
crossref pmid
10. MacKenzie EJ, Rivara FP, Jurkovich GJ, et al. A national evaluation of the effect of trauma-center care on mortality. N Engl J Med 2006; 354:366-78.
crossref pmid
11. Smith JS Jr, Martin LF, Young WW, Macioce DP. Do trauma centers improve outcome over non-trauma centers: the evaluation of regional trauma care using discharge abstract data and patient management categories. J Trauma 1990; 30:1533-8.
crossref pmid
12. MRC CRASH Trial Collaborators, Perel P, Arango M, et al. Predicting outcome after traumatic brain injury: practical prognostic models based on large cohort of international patients. BMJ 2008; 336:425-9.
crossref pmid pmc
13. Perel P, Edwards P, Wentz R, Roberts I. Systematic review of prognostic models in traumatic brain injury. BMC Med Inform Decis Mak 2006; 6:38.
crossref pmid pmc pdf
14. Miller PR, Chang MC, Hoth JJ, et al. Predicting mortality and independence at discharge in the aging traumatic brain injury population using data available at admission. J Am Coll Surg 2017; 224:680-5.
crossref pmid
15. Steyerberg EW, Mushkudiani N, Perel P, et al. Predicting outcome after traumatic brain injury: development and international validation of prognostic scores based on admission characteristics. PLoS Med 2008; 5:e165.
crossref pmid pmc
16. Spaite DW, Hu C, Bobrow BJ, et al. Mortality and prehospital blood pressure in patients with major traumatic brain injury: implications for the hypotension threshold. JAMA Surg 2017; 152:360-8.
crossref pmid pmc
17. Spaite DW, Hu C, Bobrow BJ, et al. The effect of combined out-of-hospital hypotension and hypoxia on mortality in major traumatic brain injury. Ann Emerg Med 2017; 69:62-72.
crossref pmid
18. Butcher I, Maas AI, Lu J, et al. Prognostic value of admission blood pressure in traumatic brain injury: results from the IMPACT study. J Neurotrauma 2007; 24:294-302.
crossref pmid
19. Chi JH, Knudson MM, Vassar MJ, et al. Prehospital hypoxia affects outcome in patients with traumatic brain injury: a prospective multicenter study. J Trauma 2006; 61:1134-41.
crossref pmid
20. Woodford MR, Mackenzie CF, DuBose J, et al. Continuously recorded oxygen saturation and heart rate during prehospital transport outperform initial measurement in prediction of mortality after trauma. J Trauma Acute Care Surg 2012; 72:1006-11.
crossref pmid
21. Mower WR, Sachs C, Nicklin EL, Safa P, Baraff LJ. A comparison of pulse oximetry and respiratory rate in patient screening. Respir Med 1996; 90:593-9.
crossref pmid
22. Jay GD, Hughes L, Renzi FP. Pulse oximetry is accurate in acute anemia from hemorrhage. Ann Emerg Med 1994; 24:32-5.
crossref pmid
23. Falconer RJ, Robinson BJ. Comparison of pulse oximeters: accuracy at low arterial pressure in volunteers. Br J Anaesth 1990; 65:552-7.
crossref pmid pdf
24. Yelderman M, New W Jr. Evaluation of pulse oximetry. Anesthesiology 1983; 59:349-52.
crossref pmid
25. Healey C, Osler TM, Rogers FB, et al. Improving the Glasgow Coma Scale score: motor score alone is a better predictor. J Trauma 2003; 54:671-8.
crossref pmid
26. Kupas DF, Melnychuk EM, Young AJ. Glasgow coma scale motor component (“patient does not follow commands”) performs similarly to total glasgow coma scale in predicting severe injury in trauma patients. Ann Emerg Med 2016; 68:744-50.
crossref pmid
27. Champion HR, Sacco WJ, Copes WS, Gann DS, Gennarelli TA, Flanagan ME. A revision of the Trauma Score. J Trauma 1989; 29:623-9.
crossref pmid
28. Sasser SM, Hunt RC, Faul M, et al. Guidelines for field triage of injured patients: recommendations of the National Expert Panel on Field Triage, 2011. MMWR Recomm Rep 2012; 61:1-20.

29. Moon BH, Lee SM, Oh M, Ryu HH, Heo T. Analysis of emergency department utilization rate by region, emergency medical center, and hospital type. J Korean Soc Emerg Med 2016; 27:442-9.

30. Gennarelli TA, Wodzin E. AIS 2005: a contemporary injury scale. Injury 2006; 37:1083-91.
crossref pmid
31. Spaite DW, Hu C, Bobrow BJ, et al. Association of out-of-hospital hypotension depth and duration with traumatic brain injury mortality. Ann Emerg Med 2017; 70:522-30.
crossref pmid pmc
32. World Health Organization. Health statistics and information systems: definition of an older or elderly person. Geneva: World Health Organization; 2015.

33. van Laarhoven JJ, Lansink KW, van Heijl M, Lichtveld RA, Leenen LP. Accuracy of the field triage protocol in selecting severely injured patients after high energy trauma. Injury 2014; 45:869-73.
crossref pmid
34. Philip KE, Pack E, Cambiano V, Rollmann H, Weil S, O’Beirne J. The accuracy of respiratory rate assessment by doctors in a London teaching hospital: a cross-sectional study. J Clin Monit Comput 2015; 29:455-60.
crossref pmid pdf
35. Lovett PB, Buchwald JM, Sturmann K, Bijur P. The vexatious vital: neither clinical measurements by nurses nor an electronic monitor provides accurate measurements of respiratory rate in triage. Ann Emerg Med 2005; 45:68-76.
crossref pmid
36. Jeong JH, Park YJ, Kim DH, et al. The new trauma score (NTS): a modification of the revised trauma score for better trauma mortality prediction. BMC Surg 2017; 17:77.
crossref pmid pmc pdf
37. Kondo Y, Abe T, Kohshi K, Tokuda Y, Cook EF, Kukita I. Revised trauma scoring system to predict in-hospital mortality in the emergency department: Glasgow Coma Scale, Age, and Systolic Blood Pressure score. Crit Care 2011; 15:R191.
crossref pmid pmc
38. Sartorius D, Le Manach Y, David JS, et al. Mechanism, glasgow coma scale, age, and arterial pressure (MGAP): a new simple prehospital triage score to predict mortality in trauma patients. Crit Care Med 2010; 38:831-7.
crossref pmid
39. Maas AI, Hukkelhoven CW, Marshall LF, Steyerberg EW. Prediction of outcome in traumatic brain injury with computed tomographic characteristics: a comparison between the computed tomographic classification and combinations of computed tomographic predictors. Neurosurgery 2005; 57:1173-82.
crossref pmid pdf

Fig. 1.
Inclusion criteria. EMS, emergency medical service; TBI, traumatic brain injury; ED, emergency department; SBP, systolic blood pressure; SPO2, oxygen saturation; GCS, Glasgow Coma Scale; GOS, Glasgow Outcome Scale; NTS-TBI, new prehospital trauma score for traumatic brain injury.
ceem-18-027f1.jpg
Table 1.
Demographic characteristics of the study population
Total Outcome
Survived Mortality P-value GOS score 4–5 GOS score 2–3 P-value
Number 3,642 (100) 3,216 (88.3) 426 (11.7) 2,764 (75.9) 452 (12.4)
Age (yr) 53.2 ± 17.7 52.3 ± 17.6 60.5 ± 17.0 < 0.01 51.9 ± 17.6 54.5 ± 17.6 < 0.01
Sex, male 2,630 (72.2) 2,321 (88.3 309 (11.7) 0.87 1,958 (74.4) 363 (13.8) < 0.01
Mode of injury 0.01 0.10
 Traffic accident 2,274 (62.4) 2,027 (89.1) 247 (10.9) 1,747 (76.8) 280 (12.3)
 Fall/slip 1,188 (32.6) 1,021 (85.9) 167 (14.1) 864 (72.7) 157 (13.2)
 Blunt 146 (4) 137 (93.8) 9 (6.2) 122 (83.6) 15 (10.3)
 Penetrating 26 (0.7) 24 (92.3) 2 (7.7) 24 (92.3) 0 (0)
 Machine 8 (0.2) 7 (87.5) 1 (12.5) 7 (87.5) 0 (0)
 Polytrauma 2,756 (75.7) 2,452 (89) 304 (11) 0.03 2,125 (77.1) 327 (11.9) 0.01
Region
 Rural 2,086 (57.3) 1,870 (89.6) 216 (10.4) < 0.01 1,622 (77.8) 248 (11.9) < 0.01
 Urban 1,556 (42.7) 1,346 (86.5) 210 (13.5) 1,142 (73.4) 204 (13.1)
Season
 Spring 894 (24.5) 815 (91.2) 79 (8.8) < 0.01 702 (78.5) 113 (12.6) < 0.01
 Summer 885 (24.3) 757 (85.5) 128 (14.5) 656 (74.1) 101 (11.4)
 Autumn 821 (22.5) 707 (86.1) 114 (13.9) 577 (70.3) 130 (15.8)
 Winter 1,042 (28.6) 937 (89.9) 105 (10.1) 829 (79.6) 108 (10.4)
Day/night time
 Night time 1,652 (45.4) 1,487 (90.0) 165 (10.0) < 0.01 1,274 (77.1) 213 (12.9) 0.01
 Day timea) 1,990 (54.6) 1,729 (86.9) 261 (13.1) 1,490 (74.9) 239 (12.0)
Level of ED
 1 671 (18.4) 554 (82.6) 117 (17.4) < 0.01 462 (68.9) 92 (13.7) < 0.01
 2 1,615 (44.3) 1,368 (84.7) 247 (15.3) 1,203 (74.5) 165 (10.2)
 3 1,356 (37.2) 1,294 (95.4) 62 (4.6) 1,099 (81) 195 (14.4)

Values are presented as number (%) or mean±standard deviation.

GOS, Glasgow Outcome Scale; ED, emergency department.

a) Day time was defined as EMS call time between 7 a.m. and 7 p.m. and night time as EMS call between 7 p.m. and 7 a.m.

Table 2.
Variables of NTS-TBI model, RTS, and ISS
Total Outcome
Survived Died P-value GOS score 4–5 GOS score 2–3 P-value
Number 3,642 (100) 3,216 (88.3) 426 (11.7) 2,764 (75.9) 452 (12.4)
Motor GCS score 5 (4–6) 6 (4–6) 2 (1–4) < 0.01 6 (4–6) 3 (1–5) < 0.01
 1 577 (15.8) 377 (65.3) 200 (34.7) 227 (39.3) 150 (26)
 2 101 (2.8) 63 (62.4) 38 (37.6) 35 (34.7) 28 (27.7)
 3 190 (5.2) 136 (71.6) 54 (28.4) 87 (45.8) 49 (25.8)
 4 566 (15.5) 494 (87.3) 72 (12.7) 398 (70.3) 96 (17)
 5 417 (11.4) 389 (93.3) 28 (6.7) 337 (80.8) 52 (12.5)
 6 1,791 (49.2) 1,757 (98.1) 34 (1.9) 1,680 (93.8) 77 (4.3)
SBP (mmHg)
 < 90 3,404 (93.5) 3,045 (89.5) 359 (10.5) < 0.01 2,623 (77.1) 422 (12.4) < 0.01
 ≥ 90 238 (6.5) 171 (71.8) 67 (28.2) 141 (59.2) 30 (12.6)
Oxygen saturation
 < 90% 3,311 (90.9) 3,004 (90.7) 307 (9.3) < 0.01 2,617 (79.0) 387 (11.7) < 0.01
 ≥ 90% 331 (9.1) 212 (64.0) 119 (36.0) 147 (44.4) 64 (19.6)
Age group (yr)
 18–64 2,558 (70.2) 2,331 (91.1) 227 (8.9) < 0.01 2,032 (79.4) 299 (11.7) < 0.01
 ≥ 65 1,084 (29.8) 885 (81.6) 199 (18.4) 732 (67.5) 153 (14.1)
RTS 6.71 ± 1.46 6.92 ± 1.31 5.08 ± 1.53 < 0.01 7.11 ± 1.16 5.75 ± 1.52 < 0.01
ISS 11.85 ± 9.7 10.6 ± 9.0 21.6 ± 9.1 < 0.01 9.2 ± 8.1 19.0 ± 9.9 < 0.01

Values are presented as number (%), median (interquartile range), or mean±standard deviation.

NTS-TBI, new prehospital trauma score for traumatic brain injury; RTS, Revised Trauma Score; ISS, Injury Severity Score; GOS, Glasgow Outcome Scale; GCS, Glasgow Coma Scale; SBP, systolic blood pressure.

Table 3.
Internal validation of NTS-TBI
Model Number Outcome AUC 95% CI Hosmer-Lemeshow χ² P-value
Mortality
 NTS-TBI model 1 3,642 426 0.833 0.815–0.852 11.3 0.045
 NTS-TBI model 2 3,642 426 0.852 0.835–0.869 15.6 0.016
Severe disability
 NTS-TBI model 1 3,216 452 0.772 0.749–0.796 1.3 0.854
 NTS-TBI model 2 3,216 452 0.784 0.761–0.807 4.9 0.553

NTS-TBI, new prehospital trauma score for traumatic brain injury; AUC, area under the curve; CI, confidence interval.

Table 4.
External validation of NTS-TBI
Model Number Outcome AUC 95% CI Hosmer-Lemeshow χ² P-value
Mortality
 NTS-TBI model 1 4,497 721 0.779 0.762–0.800 16.2 0.006
 NTS-TBI model 2 4,497 721 0.802 0.786–0.828 8.5 0.292
Severe disability
 NTS-TBI model 1 3,777 682 0.748 0.733–0.763 8.9 0.112
 NTS-TBI model 2 3,777 682 0.763 0.749–0.778 0.8 0.997

NTS-TBI, new prehospital trauma score for traumatic brain injury; AUC, area under the curve; CI, confidence interval.

Table 5.
Comparison of discriminative power of NTS-TBI and RTS
Model AUC
Difference of AUC with RTS
Value 95% CI Estimate 95% CI P-value
Mortality
 RTS 0.819 0.799–0.839 Reference
 NTS-TBI model 1 0.833 0.815–0.852 0.013 0.004 0.022 < 0.01
 NTS-TBI model 2 0.852 0.835–0.869 0.032 0.021 0.043 < 0.01
Severe disability
 RTS 0.761 0.737–0.785 Reference
 NTS-TBI model 1 0.772 0.749–0.796 0.012 -0.002 0.026 0.09
 NTS-TBI model 2 0.784 0.761–0.807 0.023 0.008 0.038 < 0.01

NTS-TBI, new prehospital trauma score for traumatic brain injury; RTS, Revised Trauma Score; AUC, area under the curve; CI, confidence interval.

TOOLS
PDF Links  PDF Links
PubReader  PubReader
ePub Link  ePub Link
XML Download  XML Download
Full text via DOI  Full text via DOI
Download Citation  Download Citation
  Print
Share:      
METRICS
4
Web of Science
5
Crossref
0
Scopus
6,296
View
165
Download
Editorial Office
The Korean Society of Emergency Medicine
101-3104, Brownstone Seoul, 464 Cheongpa-ro, Jung-gu, Seoul 04510, Korea
TEL: +82-31-709-0918   E-mail: office@ceemjournal.org
About |  Browse Articles |  Current Issue |  For Authors and Reviewers
Copyright © by The Korean Society of Emergency Medicine.                 Developed in M2PI