


INTRODUCTION
With the development of medical technology and improvement in healthy lifestyles, the average life span of human beings is increasing; therefore, the number of elderly people is also increasing. The rate of increase of the elderly population in Korea is the highest in the world. An aging society is defined as a society with more than 7% of the population aged 65 or older; a population with more than 14% is an aged society, and a population with more than 20% is defined as a super aging society [1]. It took approximately 110 years for the number of people over the age of 65 years in France to increase from 7% to 14%. The same process took approximately 80 years in Sweden, approximately 50 years in the United Kingdom, and approximately 20 years in Brazil and Korea [2].
In 2015, the percentage of people aged 65 or older in Korea was 13.2%, but their total medical expenses accounted for 36.5% of the national medical expenditure [3,4]. Geriatric diseases should therefore be subject to national control. Emergency medical services should be adjusted, and changed according to the increasing elderly population and corresponding medical expenditure. However, as aging progresses, pathophysiologic changes occur, and chronic illnesses, muscular weakness, and deterioration of cognitive function are present more often with aging. Because diseases of elderly population also vary according to age, it is necessary to classify elderly adults according to age, to properly investigate geriatric diseases. However, most studies among elderly people thus far have classified elderly adults into one group. Although there are different ways to classify this population, some studies have classified elderly adults between the ages of 65 and 74 years as youngest-old, those between ages 75 and 84 years as middle-old, and those aged over 85 years as oldest-old [5]. Therefore, we sought to investigate the clinical differences between patients aged 65 years or older, who visited the emergency department (ED), classified as youngest-old, middle-old, or oldest-old according to age.
METHODS
Study participants and methods
A retrospective study was conducted using medical records of patients aged 65 years or more who had visited the ED of one university hospital in Korea over a 2-year period from January 1, 2015 to December 31, 2016. Patients who died without cardiopulmonary resuscitation while visiting the ED were excluded from the study. Patients were classified as group 1 (youngest-old), ranging from ages 65 to 74 years; group 2 (middle-old), ranging from ages 75 to 84 years; and group 3 (oldest-old), aged more than 85 years. For each elderly age group, we collected data regarding sex, reasons for the ED visit, means of transport and route of the visit, results of ED treatment, admission department, type of hospitalization room, and status at discharge. The reasons for ED visits were classified into medical causes and non-medical causes according to chief complaint. Medical causes included cases of spontaneous, internal organ dysfunction. Non-medical causes included cases of trauma, poisoning, and general procedures. ED disposition was classified as admission, discharge, death, transfer, and others; disposition after admission was also recorded. The departments of admission were internal medicine, surgery, neurology-neurosurgery, orthopedics, and others (anesthesiology, urology, obstetrics, dental, dermatology, and thoracic surgery, and so on). We also recorded the internal medicine area to which patients were admitted. The type of admission room was classified as either intensive care unit (ICU) or general ward. The length of ED stay and hospital stay were investigated. This study was conducted with the approval of the Institutional Review Board of this institution (SC17RESI0042). The informed consent was waived due to the retrospective nature of the study.
Statistical analysis
Statistical processing of the data was performed using PASW Statistics ver. 18.0 (SPSS Inc., Chicago, IL, USA). In the case of continuous variables among the three groups, ANOVA was performed to determine mean values and 95% confidence intervals (CIs), and post hoc tests were conducted to confirm where differences occurred between the groups. Discontinuous variables were expressed as frequencies and percentages, and a chi-square test or Fisher exact test was used. A P-value of less than 0.05 was considered statistically significant.
RESULTS
Demographic characteristics of elderly patients
During the study period, a total of 66,493 patients visited the ED, 11,236 of which were elderly patients (16.9%) over 65 years old. Among these patients, 6,230 (55.4%) were female (Table 1). The proportion of female patients increased with age, with 2,597 (51.5%) in group 1, 2,514 (54.9%) in group 2, and 1,119 (69.1%) in group 3 (P<0.001). Of these elderly patients, 9,051 (80.6%) visited the ED for medical causes and 2,185 (19.4%) for non-medical causes. The rate of non-medical cases decreased with increasing age (20.5% vs. 18.7% vs. 18.3% for groups 1, 2, and 3, respectively, P=0.045). Of these patients, 1,602 (14.3%) were transferred from other hospitals. Transfer events increased with increasing age: 12.2% of patients in group 1, 15.4% in group 2, and 17.5% in group 3 (P<0.001). An emergency ambulance was used by 38.0% of cases as a means of transportation to the ED; 35.0% of these were patients in group 1 and 46.0% were in group 3, thus ambulance use was most frequent in the old-old group (P<0.001).
Disposition from the ED
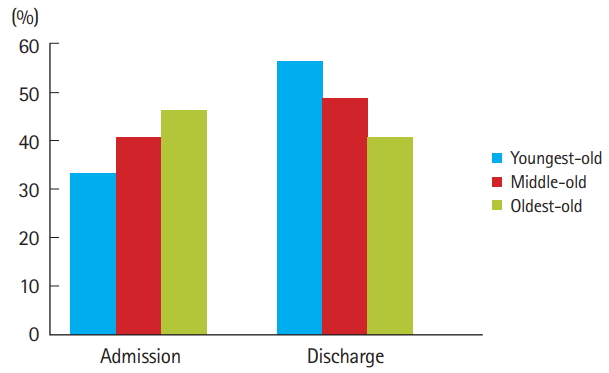
ED disposition significantly differed between the groups (Table 2). Among all elderly patients who visited the ED, 4,523 (40.3%) were hospitalized, with hospitalization rate increasing with age (35.3% vs. 42.8% vs. 48.5%, P<0.001). About half of patients over 85 years of age were hospitalized. Conversely, the discharge rate decreased with age, with 2,941 (58.4%) discharged in group 1, 2,323 (50.7%) in group 2 and 690 (42.6%) in group 3 (Fig. 1). A total 158 (1.4%) deaths occurred in the ED during treatment. Among these, 42 cases (0.8%) were in group 1, 74 cases (1.6%) were in group 2, and 42 cases (2.6%) were in group 3. Thus, the mortality rate also increased with age (P<0.001) (Fig. 2).
Types of admission and disposition after hospitalization
Of the total admitted elderly patients, 984 (21.8%) were admitted to the ICU, composing 375 (21.1%) in group 1, 428 (21.8%) in group 2 and 181 (23.1%), in group 3. However, there was no significant difference between the groups regarding hospitalization in the ICU (P=0.545) (Table 3).
Differences were found between the groups in the analysis of admission department. A total 59.5% of patients were admitted to the internal medicine department, the most frequent compared with other departments. The rate of hospitalization in internal medicine and orthopedics showed an increasing trend with increasing age. Conversely, hospitalization in neurology-neurosurgery and general surgery was lower for groups 2, and group 3 (P<0.001). Regarding hospitalization in the internal medicine department, pulmonology hospitalization was the most frequent among all three groups. In group 3, 33.6% of patients were hospitalized in pulmonology, which was greater than in group 1 (29.0%) and group 2 (32.3%) (P=0.040).
After hospitalization, the discharge rate was lower among older patients, 1,500 patients (84.5%) in group 1, 1,546 (78.8%) in group 2, and 561 (71.5%) in group 3 (P<0.001). The mortality rate after hospitalization increased with patientsŌĆÖ age: 113 patients (6.3%) in group 1, 203 (10.3%) in group 2, and 102 (13.0%) in group 3. There were significant differences in the disposition after hospitalization according to age (P<0.001) (Table 2).
Length of stay in ED and length of hospitalization
Mean values for length of stay (LOS) in the ED were 331 minutes (319 to 343 minutes, 95% CI) for group 1, 379 minutes (366 to 392 minutes, 95% CI) for group 2, and 407 minutes (386 to 429 minutes, 95% CI) for group 3. The ED LOS increased with patientsŌĆÖ age (P<0.001). The overall length of hospitalization also increased with age: 14.1 days (13.3 to 15.8 days, 95% CI) in group 1, 15.3 days (14.6 to 16.1 days, 95% CI) in group 2, and 17.5 days (16.1 to 18.9 days, 95% CI) in group 3 (P<0.001). The time spent in the ICU was also greater among patients in group 3 with ICU stays of 6.1 days (5.3 to 6.8 days, 95% CI), 6.7 days (5.9 to 7.6 days, 95% CI), and 8.1 days (6.5 to 9.7 days, 95% CI) for groups 1, 2, and 3, respectively (P=0.034) (Table 4).
DISCUSSION
Korea has the fastest growth rate of the elderly population among the Organization for Economic Cooperation and Development countries. According to data from Statistics Korea from 2015, the number of people aged 65 and over was 6,569,082, and the number of women was 3,805,675 (57%). The number of women over 85 years old was 391,179 (75%) out of 523,370, and the proportion of the female population increased with age [3]. According to national statistics, 49% of women over 60 years old visited the ED in 2015. Women represented 51.17% of patients aged 70 to 79 years and 61.68% of those over 80 years of age. These frequencies show that the rate of ED visits for female patients increases with age [6]. In this study, there were more female than male patients. Women accounted for 55.4% of all elderly patients, 51.5% of the youngest-old group, 54.9% of the middle-old group, and 69.1% of the oldest-old group. Therefore, both government health policies and hospital managers should consider expanding the number of female wards and specialized medical services for women.
The main reason for elderly patients visiting the ED was medical causes (80.6%), and this ratio increased with age. Although the underlying diseases were not investigated in this study, it has been reported that elderly people have four to five diseases on average, which may be the reason for increasing medical diseases with increasing age [7]. Also, the decreased function with aging of internal organs such as those of the respiratory, cardiovascular, and digestive systems, as well as poor immunity and nutritional imbalance would contribute to the occurrence of medical events. On the other hand, activities such as participating in sports and driving decrease with age, which may lead to a corresponding decrease in non-medical diseases among older individuals.
Despite a decline in non-medical events, the probability of fracture of the femur neck, vertebra, and wrist increases with trauma owing to osteoporosis, which is more likely to develop as people age. This is reflected in the increased ratio of admission to orthopedic surgery with increased age. According to the results of age-specific osteoporosis tests conducted in Australia, age-related osteoporosis was found in 20% of patients aged 50 to 59 years, 46% of patients aged 60 to 69 years, 59% of those aged 70 to 79 years, and 69% of patients aged over 80 years [8]. Additionally, in Korea the prevalence of osteoporosis is increasing with age, with higher prevalence in women than in men. Therefore, the diagnosis and treatment of osteoporosis should be strongly encouraged in the elderly population [9]. Moreover, the most common cause of elderly trauma is falling [10,11]. One of the causes of falling is syncope or near-syncope caused by underlying diseases such as arrhythmia, acute coronary syndrome, hypoglycemia, anemia, gastrointestinal bleeding, and antihypertensive agents. In addition, there are various other causes such as visual impairment, drunkenness, sleeping pills, and mechanical falls due to paralysis caused by stroke or neuromuscular disease. Therefore, it is necessary to adjust the living spaces of elderly adults so that falls and slips do not occur.
In Korea, the use of an emergency ambulance (summoned by dialing 119, the emergency assistance number in Korea) is very common. Over one-third of elderly patients, and about half of patients older than 85 years, use 119 ambulances as a means of transportation to the ED. In contrast to elderly patients, 119 ambulances are called for under 30% of pediatric patients [12]. Therefore, ambulance medical equipment and environments should be tailored to the needs of elderly patients.
There was an absolute difference in admission department between the groups. Among hospitalized elderly patients, two-thirds of old-old patients were admitted to the internal medicine department. Together, all three groups accounted for the largest number of hospitalizations in the internal medicine department. This is due to the decrease in macrophage function and potential dysfunction of T cells, which results in decreased immunity and increased susceptibility to various infectious diseases, cancer, and autoimmune diseases among elderly adults [13-15], as well as impaired function of the anti-inflammatory pathways, leading to chronic inflammation and tissue damage [16]. With age, lung parenchymal changes occur, and the lung elasticity and the chest wall compliance decrease, causing the respiratory muscles to stiffen [2], this may explain why respiratory disease is more likely to occur in elderly patients. In our study, admission for respiratory problems made up the largest proportion of internal medicine admissions. More respiratory physicians must be trained, and respiratory equipment should be in adequate supply for the care of elderly patients.
Regarding the LOS in the ED, one study found that elderly patients remained in the ED approximately 20% longer than younger patients with the same chief complaint [17]. Biber et al. [18] also reported that elderly patients had longer ED stays than non-elderly patients, 8 minutes longer in non-trauma cases and 35 minutes longer in cases of trauma. In another study, patients older than 85 years remained approximately 1.5 hours longer in the ED than those aged 65 to 74 years [19]. Our results showed that LOS in the oldest-old group was approximately 78 minutes longer than that of the youngest-old group. This demonstrates that LOS in the ED increases with increased age, perhaps because elderly patients in the ED are at high risk for associated diseases, and required more diagnostic testings and emergency treatments, as well as time-consuming consultations with various departments. In addition, studies by Choi et al. and Chung et al. reported that increased LOS among elderly patients is mostly influenced by wait times for admission [20,21]. Therefore, an effective national policy for managing ED over-crowding and LOS should be developed.
This study revealed that there was no difference in the admission rate to the ICU between groups, but a difference was found for the length of ICU stay between groups 1 and 3. This might be due to the better physiologic capacity and response to treatment of patients in group 1, who are younger than those in group 3. However, for more accurate investigation of this question, information about disease severity, such as triage level at the time of ED arrival, as well as APACHE (acute physiology and chronic health evaluation) scores should be collected.
There are several limitations in this study. First, the study was conducted over 2 years at one university hospital located in the capital city of Korea. Therefore, the results may be difficult to apply to all elderly patients in the country, owing to characteristics of the region, hospital scale, and study period. Analysis using national data should be conducted, for more accurate research. Second, this was a retrospective study conducted through the review of medical records, and there may have been errors or insufficient information in these records. Third, this study included the period before use of the Korean Triage and Acuity Scale had been initiated, therefore, it is difficult to know the exact disease severity of study participants at the time of their ED visit. Nevertheless, this study is important in confirming the clinical differences between youngest-old, middle-old, and oldest-old patients in Korea, as there is insufficient previous research regarding these age groups. Based on this research, further prospective and multicenter studies using national data on ED visits in elderly patients by age groups should be conducted in the near future.
We found that elderly adults were more likely to visit the ED for medical reasons, and the percentage of women visiting the ED increased with age. The rate of ED visits made using an emergency ambulance transport was found to increase with age, as did hospitalization rates and number of hospitalizations in internal medicine and orthopedics. The LOS in the ED and total length of hospitalization increased with older age, as did the ED mortality rate and hospital mortality rate. Due to differences among the age groups, we suggest that medical services that are customized to the needs of elderly patients should be developed and provided at the national level.