


INTRODUCTION
Many patients come to the emergency department (ED) due to traumatic brain injury (TBI) and undergo brain computed tomography (CT). TBI is one of the important public health concerns because it occurs in relatively young and healthy adults and its complications, such as memory disruption, decreasing cognitive ability, and visual impairment, cause loss of personal and social functions [1,2]. In the US, approximately 2.8 million people are hospitalized annually due to TBI [3]. Currently, patients with a Glasgow Coma Scale (GCS) of 14 or less are required to undergo a brain CT in South Korea, and consequently the number of brain CTs is increasing, which has in turn influenced the overcrowding of EDs. In the US, approximately 44.3% of mild TBI patients visiting the ED undergo a brain CT [4]. It has been reported that approximately 1/3 of the death-related damage cases are related to TBI in the US [5]. CT scans of mild TBI patients in the ED should only be performed when deemed necessary, taking into consideration the allocation of resources and exposure to radiation. With regard to ED overcrowding, high demand for emergency services is considered to be related to particular demographic characteristics. Children and elderly individuals seem to have differences in injury mechanism and severity [6,7].
If the increased brain CT demand in mild case patients outnumber the capacity of the ED, emergency treatment of severe case patients can be delayed along with increased wait times and reduced quality of treatment. Therefore, the inefficiency associated with ED overcrowding can be very impactful, and performing brain CTs in the ED influences the quality of care. It is necessary to understand and manage patients according to demographic characteristics in order to employ resources more efficiently. These demographic characteristics are likely to be also related to the social setting of the patient and the country including the type of insurance [8].
Unfortunately, there were few studies on these characteristics. In the US, TBI patientŌĆÖs epidemiological characteristics differ by age and sex [2]. In South Korea, however, there is no analysis in this regard [2,9]. Therefore, we hypothesized that the epidemiological characteristics of TBI patients would be different in each age group. This study analyzed the characteristics of TBI patients who visited the ED and underwent brain CTs for verification of the study hypothesis.
METHODS
Study design and data collection
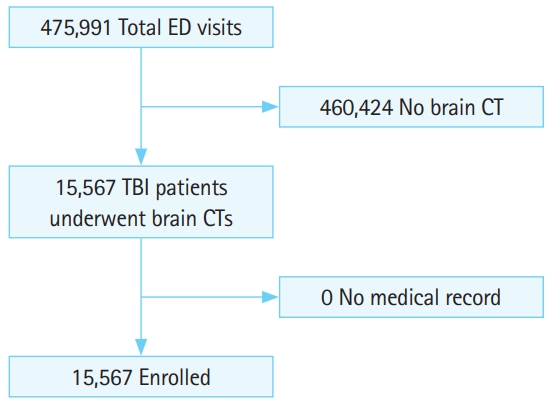
All trauma patients who underwent brain CT scan at the EDs of Korea University Hospitals (three hospitals) from March 2013 to February 2016 were included. The subjects of this study were in all age groups (Fig. 1). Medical records were investigated retrospectively. The annual number of patients who visited the ED in the three tertiary hospitals for the given period was 158,664. Patients with incomplete medical records were excluded.
Outcome measures
The patientsŌĆÖ basic characteristics (age, sex, ED diagnosis, ED disposition, injury mechanism, GCS score, transportation means, and undergoing brain surgery) were analyzed, and categorized into different age groups. GCS score was estimated at initial ED visit. The purpose was to compare the characteristics in each age group including sex and severity as assessed by the GCS score, trauma mechanism, and disposition.
All statistical analyses were performed using IBM SPSS Statistics ver. 20.0 (IBM Corp., Armonk, NY, USA) and Excel (Microsoft Corporation, Redmond, WA, USA). For all analyses, P-values <0.05 were considered statistically significant. Data are expressed as number (%) or mean┬▒standard deviation.
Ethics statement
This study was approved by the ethics committee of Guro Hospital of Korea University (2018GR0200) and the researchers adhered to the principles of the Helsinki declaration. The requirement for informed consent from the participants was waived by the institutional review board due to the retrospective nature of the study.
RESULTS
Of 475,991 patients who visited the study EDs, 15,567 (3.3%) patients had a brain CT to identify TBI in the study period (Table 1). Blunt trauma was the most common cause of injury followed by car accidents (Fig. 2). Of all the patients, 10,991 (70.6%) were discharged home after treatments, 20.5% were hospitalized for treatments, and 11.9% received surgical treatments. In terms of the GCS, 93.1% scored 13 to 15 and 3.5% scored 3 to 8. In terms of public ambulance service, 8,381 (53.8%) used the services.
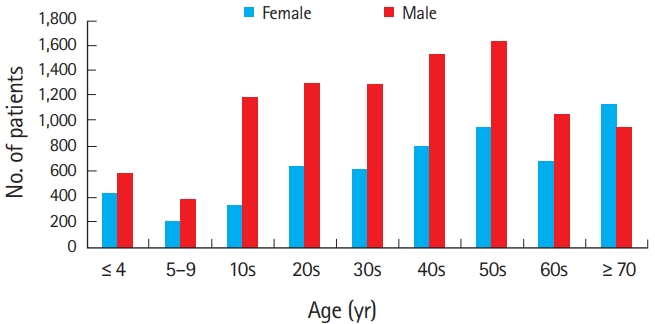
In terms of the age groups of the patients, patients in their 50s were the most common (16.5%, n=2,568) while those ages 10ŌĆō19 were the least frequent (9.7%, n=1,514). Regarding the severity according to GCS, the proportion of mild cases was high in the under 9 years of age group (99.3%) and lower in the over 70 years of age group, while the proportion of severe cases was higher in the 20s (4.6%) group and lower in the 5 to 9 years of age group. In the 50s age group, 14.3% of patients needed surgical treatment. In the under 9 years of age group, surgical treatment was rarely performed.
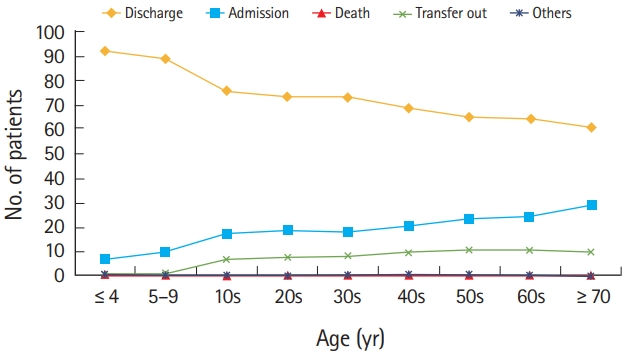
In the under 9 years of age group, the public ambulance utilization rate was lower than in all other age groups. The most common injury mechanism was blunt trauma followed by car accidents and in the under 9 years of age group, falls and same level falls were more frequent than in all other age groups (Table 2). In almost all age groups, the proportion of male patients was higher, but, in the over 70 years of age group, the proportion of female patients was higher (Table 2 and Fig. 3). In the 0 to 4 years of age group, 92.2% were discharged home after treatment. In the over 70 years of age group, 60.8% returned home. The percentage of patients who needed hospitalization tended to increase with age (Table 2 and Fig. 4).
DISCUSSION
This study compared TBI patients in all age groups who received brain CT scans in the EDs to analyze their characteristics, which were different depending on age, and region. This analysis will be clinically helpful for treatment administration and identifying risk factors for ED overcrowding by TBI patients [10].
During the study period, 15,567 patients were enrolled, most of whom (70.6%) returned home after treatment based on the results of the brain CTs. Under age 70, male patients outnumbered female patients. Many other studies on TBI also reported that male patients outnumbered females [2,7,9,11,12]. According to the 2010 data of Statistics Korea, the women-to-men ratio in the 15 to 19 years of age group was 100 to 113.3, while it was 100 to 101 in the 35 to 39 years of age group, 100 to 98.8 in the 50 to 54 years of age group, and 100 to 75.3 in the 70 to 74 years of age group. In short, in the over 50 years of age groups, women outnumbered men.
In this study, women outnumbered men in the over 70 years group. This result may be due to more females and less male social activity with aging. In this study, 92.2% (under 4) and 88.8% (5 to 9 age group) of pediatric patients aged younger than 10 years of age were considered well enough to discharge. The ratio of patients discharged declined with age. Of patients aged 70 years of age and older, 60.8% were discharged after treatment and 29% were hospitalized. Given that pediatric patients with mild GCS score accounted for 99%, hospital discharge was more common, and this tendency decreased with age.
We suppose this tendency may be due to the fact that the evaluation of children who have difficulty expressing their symptoms is highly dependent on examinations [5,13]. In a study by Keenan and Bratton [14], the number of TBI patients aged <19 years who visited EDs was >500,000 annually, of whom 60,000 were hospitalized. In this study, the hospitalization rate of the patients aged <19 years was similarly 12.5%. In a study by Kim et al. [6] on pediatric patients, 99% had a GCS score of 13 to 15. This result was similar to the results of this study. In South Korea, most medical treatments are supported by the national healthcare insurance. Some treatments are supported through the individualsŌĆÖ additional private insurance, which is considered to be an important factor for additional service use in the EDs. In addition, since the parents of younger patients are more likely to purchase private insurance, they request examinations even if the child has mild symptoms. Older age is known to be an independent predictive factor of adverse outcomes of TBI7 [15-17], as cerebrovascular autoregulation is reduced after TBI [16].
Regarding the injury mechanisms, the younger the patient, the more likely it is for blunt trauma to be responsible for TBI. Motor cycle accidents, car accidents, and same-level falls were most commonly the causes of TBI in the teenage, middle-aged, and old age groups, respectively. Kim et al. [6] reported that collisions and falls were the most common injury mechanisms in pediatric trauma patients.
In this study, falls in children <5 years of age accounted for 21.2%. This seems to be attributed to falls from the bed or cradle. Falls are known to be the most common cause of pediatric TBI cases [5]. Monsef Kasmaei et al. [10] reported that people in their 60s and older had the highest prevalence of falls and motorcycle accidents. In this study, the same-level fall (slipping down) rate among those in their 70s and older was 23.2%, which was higher than that in all other age groups, and it was the most common cause of accidents in the elderly. Car accident injuries were higher in the 20s to 60s age groups than the other age groups. Thompson et al. [7] reported that 8% of patients aged 65 years and older visiting the EDs had fall-related injuries, and that falls are the most common cause of TBI in the elderly. They also reported that the rate of TBI cases associated with car or motorcycle accidents was lower among teenagers than that in middle-aged (in their 30s and 40s) individuals. It is reasonable to assume that because the middle age group drives the most, there are more accidents in the middle age group.
The usage rate of public emergency medical services was 15.9% and 22.7% in those aged <5 and <10 years, respectively. In the over 40 years of age groups, the rate of public emergency medical services usage was Ōēź60%. This seems to be attributable to the fact that mild GCS score cases were more prevalent among the pediatric age groups. For children aged <10 years, patient guardians used their own vehicles since the children needed to be carried in their arms.
There are some limitations to this study. First, minor TBI patients who did not undergo CT scans were excluded as these patients are less likely to use the resources of the EDs. Bazarian et al. [4] reported that out of 70,900 mild TBI cases, 63,943 (90.2%) patients received CT scans. In fact, although these mild cases that do not need to be assessed using CT scans utilize certain resources such as the medical staff for diagnosis and physical examinations, such cases need to be taken into account. A second limitation of this study is that additional brain CT scans were performed due to patientsŌĆÖ strong or continuous complaints of pain, according to their disposition, or based on their firm insistence of an examination, which was either supported by their private insurance, or based on their disposition. Nevertheless, such limitations may not greatly influence the results of this study since the severity was taken into account in the comparison of each group. Finally, this retrospective study was conducted in three tertiary medical institutions. Therefore, it is difficult to generalize the results of this study for all domestic EDs.
In conclusion, in the under 70s age groups, more male patients underwent CT evaluations than female patients with TBI. There was a tendency of increased hospitalization with age. The younger the patient, the more likely that blunt trauma was responsible for TBI. Motor cycle accidents, car accidents, and same-level falls were the most common causes of TBI in the teenage, middle-aged, and old age groups, respectively. TBI may present with different characteristics depending on the age of the patients, thus suggesting that prevention policies and clinical practice should be tailored to age. The epidemiological characteristics of TBI are important reference data for the management of patients visiting EDs. Therefore, further research on these characteristics is required across the nation.