


INTRODUCTION
Electrolyte disorders are common in patients presenting to the emergency department (ED). Hyponatremia is the most common electrolyte abnormality observed and is found in approximately 3% to 6% of ED patients [1,2]. Hyponatremia is important to recognize as it has been associated with increased hospital length of stay (LOS) times, increased morbidity or mortality, and increased health care costs [3ŌĆō7]. Although there are several causes of hyponatremia, some of the more common risk factors include heart failure, chronic kidney disease, hepatic failure, body fluid losses, and disorders that increase the total body water content like the syndrome of inappropriate antidiuretic hormone and adrenal insufficiency.
Hypernatremia is less common than hyponatremia and is uncommon in previously healthy patients, as most cases are due to a total body water deficit from either poor access to water or an impaired thirst mechanism [1]. As such, hypernatremia is more commonly seen in elderly patients and patients with mental or physical impairment. Other risk factors include heat illness, increased fluid losses, excessive salt intake, and disorders that facilitate a reduction in total body water content such as diabetes insipidus. Hypernatremia is associated with increased morbidity and mortality rates among hospitalized patients [8]. One large retrospective study found that, in patients with severe hypernatremia (sodium [Na]>160 mmol/L), the mortality rate during hospitalization was almost 50% [9].
Although mild cases in asymptomatic patients may not require acute intervention, prompt recognition and treatment are required to prevent the morbidity and mortality associated with more severe cases of hyponatremia and hypernatremia. As the life expectancy in the United States continues to rise [10] and many of the disorders that cause Na abnormalities are common in the elderly, we can expect that hyponatremia and hypernatremia will continue to place a significant burden on our health care system in the decades to come.
Although Na derangements are common and potentially dangerous, there is a paucity of ED literature. Many of the studies pertaining to Na derangements involve hospitalized or ambulatory care patients [11ŌĆō13]. Some studies exist that evaluated hyponatremia or hypernatremia not in general ED patients but instead under specific circumstances, such as acute kidney injury [14], sepsis [15], or pneumonia [16]. Other ED-based studies have evaluated risk factors for hyponatremia and hypernatremia, including season and age [17ŌĆō20]. There are ED-based studies that have compared the severity and outcomes of potassium disturbances [21]; however, our review of the literature did not yield many studies comparing the prevalence and outcomes of hyponatremia and hypernatremia in ED patients.
Our study aims to evaluate the incidence rates of mild, moderate, and severe hyponatremia and hypernatremia amongst ED patients and to compare the outcomes across those groups. We also explored the association of predictor variables and outcomes. Lastly, we examined the impact of Na derangement on ED and total hospital LOS. This study is unique in that it directly compares the mortality rates of hyponatremia and hypernatremia in ED patients.
METHODS
Study design, setting, and patients
This study was a structured, retrospective review of electronic medical records for consecutive adult ED patients with Na levels measured while in the ED in 2019. All adult patients (>18 years of age) who had a Na level measured were included. There were no exclusion criteria other than adult patients without a Na level measurement. This was a single-center study that took place at a tertiary care, level I trauma center, which is an academic suburban ED located in Long Island, NY, USA, with approximately 100,000 annual visits.
Data collection and laboratory testing
Demographic, clinical, and laboratory data were recorded. Na was measured using a Cobas c501 analyzer (Roche), with a normal range defined as 130 to 145 mEq/L. Hyponatremia was defined as mild, moderate, and severe at <130ŌĆō134, 120ŌĆō129, and <120 mEq/L, respectively. Mild, moderate, and severe hypernatremia were defined as 146ŌĆō149, 150ŌĆō169, and >170 mEq/L, respectively. The mortality rate was defined by the number of deaths that occurred in the hospital.
Outcomes
Our primary outcome was in-hospital death. Secondary outcomes were hospital admission, intensive care unit (ICU) admission, ED LOS, and hospital LOS.
Data analysis
We used descriptive statistics to summarize the data. Binary and categorical data are presented as numbers and percentages frequencies of occurrence and compared across groups with the chi-squared or Fisher exact test as appropriate. Continuous data are presented as means and standard deviations or medians and interquartile ranges. Univariable analysis and multivariable linear regression were used to compare outcomes by Na level and are presented as adjusted odds ratios (aORs). Multivariable models adopted linear regression for LOS data and logistic regression for admission, ICU, and mortality data, with coefficients for the former and ORs for the latter. Multivariable outcome predictors, including sex, age, and the presence and severity of dysnatremia, were analyzed, and ORs were calculated to determine the impact on hospital admission, ICU admission, and mortality. Coefficients were calculated for various LOS predictors, including age, sex, Na level, and Charlson Comorbidity Index (CCI). All analyses were conducted using IBM SPSS ver. 27 (IBM Corp).
RESULTS
A total of 106,764 ED visits occurred in 2019 and, during these visits, Na was measured in 57,427 adults (54%). Forty-six percent of these patients were male, and their mean┬▒standard deviation age was 54┬▒21 years. The mean CCI was 1.4┬▒1.8 points. A summary of results is presented in Table 1.
As seen in Table 2, mild, moderate, and severe hyponatremia occurred in 8%, 2%, and 0.1% of patients, respectively, while mild, moderate, and severe hypernatremia occurred in 1%, 0.2%, and <0.1% of patients. For mild and moderate hyponatremia, rates were similar in men and women (49% vs. 51%); however, we found a female sex predominance in the group of patients with severe hyponatremia (64% female vs. 36% male). In the mild and moderate hypernatremia groups, we found a slight male predominance; conversely, 57% of the cases of severe hypernatremia were observed in women. The mean age was higher in patients with hyponatremia compared to normal Na levels. The mean age was also higher in patients with hypernatremia compared to normal Na levels, with the most drastic difference observed in the severe hypernatremia category (mean age, 82 years vs. 53 years for the normal Na population). The mean CCI score was higher in all groups of hyponatremia and hypernatremia compared to pa57tients with normal Na levels.
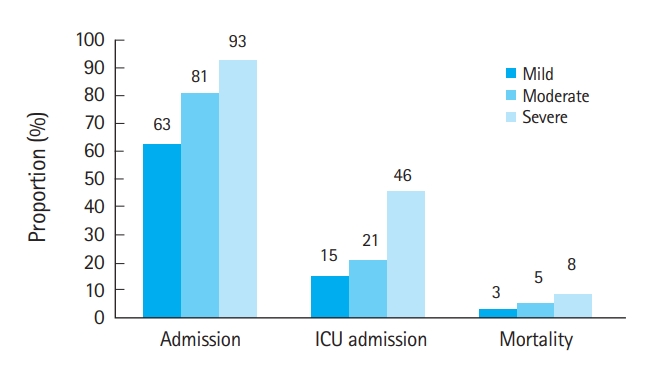
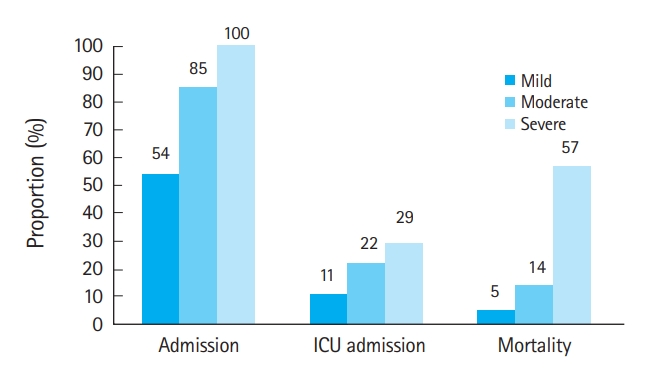
Outcome data are summarized in Table 3 and Figs. 1 and 2. Admission, ICU admission, and mortality rates increased as Na levels increased or decreased further from normal. Hypernatremia was associated with a greater risk of death than hyponatremia. Compared to patients with normal Na levels, the aOR (95% confidence interval [CI]) values of mortality in patients with hyponatremia were as follows: mild, 2.39 (1.97ŌĆō2.90); moderate, 3.93 (2.95ŌĆō5.24); and severe, 6.98 (2.87ŌĆō16.40). In comparing the hypernatremia group to patients with normal Na levels, the aOR (95% CI) values of mortality were as follows: mild, 3.65 (2.47ŌĆō5.40); moderate, 8.58 (4.92ŌĆō14.94); and severe, 55.75 (11.37ŌĆō273.30). Age (aOR, 1.048; 95% CI, 1.043ŌĆō1.053) and female sex (aOR, 0.70; 95% CI, 0.60ŌĆō0.81) were also associated with mortality, and the CCI was associated with admission rate (aOR, 1.21; 95% CI, 1.19ŌĆō1.22).
LOS data are reported in Table 4. Multivariable linear regression was used to analyze the data. Coefficients indicate the increased number of LOS hours if the factor is present. Stepwise linear regression was performed with potential predictors such as age, sex, Na level, and CCI. Patients with moderate and severe hypernatremia were combined into a single group due to the small number of severe cases. For all calculated LOS data, increased age led to increased LOS times. Excluding deaths, for the total LOS (ED discharges and admissions), male sex and CCI were associated with greater LOS times with coefficients of 18.0 and 8.8, respectively. All severities of hyponatremia and hypernatremia increased the LOS, and the increase in LOS was proportional to the degree of Na derangement, with the largest coefficients seen in severe hyponatremia (169.2) and moderate/severe hypernatremia (112.6). Total LOS data for admitted patients showed similar yet less drastic trends, with male sex (coefficient, 33.8), CCI (coefficient, 4.9), and Na derangement (severe hyponatremia coefficient, 112.5; moderate hyponatremia coefficient, 55.1; mild hyponatremia coefficient, 29.6; mild hypernatremia coefficient, 84.2; moderate/severe hypernatremia coefficient, 70.7) leading to increased LOS times. For ED LOS, similar associations were found, yet the effect of all predictors on ED LOS was smaller than that on total LOS. For ED LOS, coefficients were as follows: male sex, 0.85; CCI, 0.151; severe hyponatremia, 11.3; moderate hyponatremia, 2.6; mild hyponatremia, 1.1; mild hypernatremia, 3.7; and moderate/severe hypernatremia, 6.6.
Table 5 shows the rates of hospital admission, ICU admission, death, and LOS for patients with varying degrees of hyponatremia, hypernatremia, and normal Na levels. As expected, the presence of hyponatremia and hypernatremia led to increased rates of hospital admission, which were proportional to the severity of the dysnatremia. Ninety-three percent of patients with severe hyponatremia and 100% of patients with severe hypernatremia were admitted compared to 39% of patients with normal Na levels. This trend was also reflected in ICU admission rates, with severe, moderate, and mild hyponatremia ICU admission rates of 49%, 26%, and 24% recorded, respectively, compared to the lower rate of ICU admission of patients with normal Na levels (23%). For patients with severe, moderate, and mild hypernatremia, the ICU admission rates were 29%, 26%, and 21%, respectively. Rates of death were higher in patients with dysnatremia compared to normal Na levels. For patients with severe, moderate, and mild hyponatremia, death rates were 8%, 5%, and 3%, respectively, while, for those with severe, moderate, and mild hypernatremia, death rates were 57%, 14%, and 5%, respectively. Only 1% of deaths occurred in patients with normal Na levels. Lastly, the LOS data in Table 4 show that abnormal Na levels contributed to increased total and ED LOS times. For all categories (total LOS [all patients], ED LOS, and total LOS [admitted patients]), patients with mild, moderate, and severe hyponatremia and hypernatremia had more LOS hours than those with normal Na levels.
DISCUSSION
Sodium disorders are commonŌĆöone population-based cross-sectional study of >14,000 adults recorded a hyponatremia prevalence rate of 1.72% in the general population and determined that hyponatremia predicted mortality independent of comorbidities, age, or sex [22]. Multiple studies show that severe hyponatremia and hypernatremia in hospitalized patients is associated with increased morbidity and mortality rates [3ŌĆō9]. Despite the prevalence and clinical importance of dysnatremia, there is a paucity of literature pertaining to hyponatremia and hypernatremia in the ED. One retrospective study from 2012 evaluated the prevalence and symptoms of hyponatremia and hypernatremia in the ED as well as the correction rates once hospitalized [23] and recorded prevalence rates of 10% and 2% for hyponatremia and hypernatremia in the ED, respectively. Severe hyponatremia (Na<121 mmol/L) was present in 0.38% of patients who had their Na levels checked, while severe hypernatremia (Na>149 mmol/L) was present in 0.17%. However, this study was conducted at a single hospital in Switzerland, and its results may not be generalizable to the US population.
Our study found that hyponatremia was more common than hypernatremia in ED patients and determined that mild dysnatremia was more common than severe dysnatremia. Mild, moderate, and severe hyponatremia occurred in 8%, 2%, and 0.1% of patients, respectively, whereas mild, moderate, and severe hypernatremia occurred in 1%, 0.2%, and <0.1% of patients. When assessing mild and moderate hyponatremia cases, the rates were nearly equal in men and women. In contrast, severe hyponatremia was more common in women (64% vs. 36% in men), which is consistent with findings observed in prior studies [5,22,24]. Although not entirely clear, the reasons for this difference are likely multifactorial and may include sex-related differences in Na metabolism due to estrogen stimulation of arginine vasopressin and increased expression of renal vasopressin receptors leading to greater sensitivity to antidiuretic hormone in women [24ŌĆō26].
Literature pertaining to sex differences in ED patients with hypernatremia is lacking. More data exist for hospital-acquired hypernatremia, but they are controversial, with some studies showing a female sex predominance [20,27,28] and other studies showing a male sex predominance [23,29]. In our study, there was a slight male sex predominance for mild and moderate hypernatremia, while women were predominant in the severe hypernatremia group (57% female vs. 43% male). However, severe hypernatremia was relatively rare, so an absolute difference of one patient (four women vs. three men) accounted for that observed difference. Nonetheless, we found proportionally more female patients in the extreme ranges of Na derangement (i.e., severe hyponatremia and severe hypernatremia). As expected, the CCI score was greater in all groups of hyponatremia and hypernatremia compared to patients with normal Na levels.
Our study found that patients with dysnatremia were older than those with normal Na levels. The difference was most pronounced in the severe hypernatremia category, with a mean age of 82┬▒15 years compared to mean age of 53┬▒21 years among those with normal Na levels. Our data are consistent with what is already known in the literature, as hypernatremia is more common in patients with impaired thirst or poor access to water, putting elderly patients at particularly high risk. On the other end of the spectrum, hyponatremia is also more common in elderly patients due to increased comorbidities (renal insufficiency, heart failure, etc.), diuretic use, and the syndrome of inappropriate antidiuretic hormone [7].
Our outcomes data demonstrate that both hyponatremia and hypernatremia in the ED are associated with increased risks of hospitalization, ICU admission, and death. The increases in adverse outcomes are proportional to the severity of Na derangement. Due to the retrospective and observational nature of this study, it is unclear whether the abnormality in Na concentration itself is the cause of the increased morbidity and mortality rates. Dysnatremia may also be a marker of disease severity, where the associated morbidity and mortality result from the underlying disease leading to the abnormal Na level. In some patients, both a deranged Na level and underlying diseases may have contributed to worse outcomes. These findings are not surprising, as prior studies have also shown that Na derangements are associated with higher rates of hospitalization and morbidity/mortality [3ŌĆō9]. A study by Arampatzis et al. [23] found that >20% of ED patients with severe hyponatremia (Na<121 mmol/L) and hypernatremia (Na>149 mmol/L) required ICU admission and that morbidity was greater in patients with severe hypernatremia (28%) than those with severe hyponatremia (13%). Surprisingly, 46% of patients with severe hypernatremia had no Na level checked the next day, and 18% received no treatment for their hypernatremia. These rates were higher than those of patients with severe hyponatremia (among whom 14% had no Na level checked the next day and only 4% received no treatment). Although this study was performed at a hospital in Switzerland, it highlights the importance of recognizing and properly treating severe dysnatremia. Similarly, our study found that, although hyponatremia was more common, patients with hypernatremia had worse outcomes. While the aORs of mortality were higher for all categories of hypernatremia compared to hyponatremia, the difference was most pronounced in the severe category. Compared to those for a normal Na level, the aOR (95% CI) values of mortality for severe hypernatremia were 55.75 (11.37ŌĆō273.30) compared to 6.98 (2.87ŌĆō16.40) for severe hyponatremia. We also found that age (OR, 1.048; 95% CI, 1.043ŌĆō1.053) and female sex (OR, 0.70; 95% CI, 0.60ŌĆō0.81) were associated with mortality.
Our LOS data revealed that, for all severities of hyponatremia and hypernatremia, the LOS was increased compared to that of patients with normal Na levels. In general, the severity of Na derangement was proportional to the increase in LOS time, with more severe Na derangements leading to even longer LOS times. An exception to this can be seen in the total LOS (admits only) in Table 3, where the coefficient for mild hypernatremia was 84.2 compared to that of 70.7 for moderate/severe hypernatremia. The reason for this is unclear, as deaths were excluded. Regardless, it remains clear that both hyponatremia and hypernatremia, when present, lead to an increased LOS.
Our study has several important limitations. A major limitation of our study is its retrospective nature, which is subject to numerous biases. Thus, our results demonstrate associations and cannot establish causality. As such, the results should be considered exploratory or hypothesis-generating only. As a single-center study at a large suburban academic hospital, our results may not be generalizable to different patient populations and other clinical settings. Additionally, as a retrospective chart review, our results are susceptible to selection bias. Although not a unique limitation to our study, different studies use different cutoffs to define mild, moderate, and severe dysnatremia. As such, the definitions we used may differ from those of other studies, which could impact how the data are interpreted. We did not evaluate the causes or chronicity of hyponatremia or hypernatremia in our study cohort. As these factors may significantly impact patient outcomes, future studies could yield more robust information by collecting these data. It is impossible to know the degree to which the mortality observed in our study was attributable to the dysnatremia versus other comorbid conditions, so our results are subject to residual confounding.
Hyponatremia and hypernatremia are commonly discovered in the ED, and both were associated with higher rates of hospital admission, ICU admission, and mortality. They are also associated with prolonged hospital LOS times. The study outcomes worsened according to the severity of Na derangement.