Effect of emergency medical service use on time interval from symptom onset to hospital admission for definitive care among patients with intracerebral hemorrhage: a multicenter observational study
Article information
Abstract
Objective
This study evaluated whether emergency medical service (EMS) use was associated with early arrival and admission for definitive care among intracerebral hemorrhage (ICH) patients.
Methods
Patients with ICH were enrolled from 29 hospitals between November 2007 and December 2012, excluding those patients with subarachnoid hemorrhage, traumatic ICH, and missing information. The patients were divided into four groups based on visit type to the definitive hospital emergency department (ED): direct visit by EMS (EMS-direct), direct visit without EMS (non-EMS-direct), transferred from a primary hospital by EMS (EMS-transfer), and transferred from a primary hospital without EMS (non-EMS-transfer). The outcomes were the proportions of participants within early (<1 hr) definitive hospital ED arrival from symptom onset (pS2ED) and those within early (<4 hr) admission from symptom onset (pS2AD). Adjusted odds ratios were calculated to determine the association between EMS use and outcomes with and without inter-hospital transfer.
Results
A total of 6,564 patients were enrolled. The adjusted odds ratios (95% confidence intervals) for pS2ED were 22.95 (17.73–29.72), 1.11 (0.67–1.84), and 7.95 (6.04–10.46) and those for pS2AD were 5.56 (4.70–6.56), 0.96 (0.71–1.30), and 2.35 (1.94–2.84) for the EMS-direct, EMS-transfer, and non-EMS-direct groups compared with the non-EMS-transfer group, respectively. Through the interaction model, EMS use was significantly associated with early arrival and admission among direct visiting patients but not with transferred patients.
Conclusion
EMS use was significantly associated with shorter time intervals from symptom onset to arrival and admission at a definitive care hospital. However, the effect disappeared when patients were transferred from a primary hospital.
INTRODUCTION
Worldwide, the overall age-standardized incidence of stroke among people over 55 years old ranges from 4.2 to 11.7 per 1,000 person-years. The proportion of primary intracerebral hemorrhage (ICH) among total stroke patients ranges from 6.5% to 19.6% and is associated with high mortality rates. The overall case-fatality within one month is higher for patients with ICH (42%) and subarachnoid hemorrhage (32%) than for those with ischemic stroke (16%) [1]. Therefore, more studies on ICH are needed from a public health standpoint. In Korea, death following stroke accounts for approximately one of every 10 deaths. The annual stroke mortality rate in 2010 was 53.2 per 100,000 people. According to Korean hospital registry studies, the 90-day mortality rate was 3% to 7% for ischemic stroke and 17% for ICH. Younger people were more often affected by ICH than older individuals were, and the ICH mortality rates among those younger than 55 years of age were 41.2% and 27.3% for men and women, respectively [2].
The guidelines for management of ICH are subdivided into diagnosis, management, rehabilitation, and prevention of recurrence. These guidelines offer a framework for the early diagnosis and the goal-directed treatment of patients with ICH [3,4]. Many centers have developed critical pathways for the treatment of acute ischemic stroke. These pathways might facilitate more efficient, standardized, and integrated management of stroke patients [5]. Although screening tools exist for the early diagnosis of stroke at a prehospital stage, this effort is principally targeted at ischemic strokes. Few centers have ICH management protocols, even at the emergency department (ED) stage. According to evidence based on the ICH guidelines, the objective of medical care in prehospital settings is to provide resuscitative support and transport for critical patients, obtain a focused history of symptom onset (or the time the patient was last normal), and provide advanced notice to the ED of the impending arrival of a potential stroke patient so that critical pathways can be initiated and consulting services can be alerted. Advance notice by emergency medical services (EMSs) significantly shortens the time to begin computed tomography (CT) scanning in the ED [3,6]. Thus, EMS use is a strong driving force for the early goal-directed diagnosis and treatment of ICH.
We hypothesized that EMS use would shorten the time to final management among patients with ICH and ultimately lead to favorable outcomes. The purpose of this study was to evaluate how EMS use influences the arrival and admission time of patients with ICH to a definitive care hospital.
METHODS
Study design and participants
This multicenter observational study series used information obtained from a database from the ED-based cardiovascular surveillance project for acute myocardial infarction (AMI) and acute stroke in Korea supported by the Korea Centers for Disease Control and Prevention. Data were collected from 29 hospitals in Korea between November 1, 2007 and December 31, 2012. During the study period, 9,399 and 45,424 patients with AMIs and acute stroke were registered, respectively. The target diseases of this study were non-ST elevation AMI and ST-elevation AMI, acute ischemic stroke, acute hemorrhagic stroke, and subarachnoid hemorrhage.
The target diagnosis in this study was non-traumatic ICH based on the international diagnosis code (I61.0 to I61.9) at hospital discharge. Patients who met the following criteria were excluded: younger than 18 years of age, hemorrhagic conversion after fibrinolysis therapy, arrival at the ED more than seven days after symptom onset, unknown information regarding EMS use and inter-hospital transfer, discharge from the ED without definitive care, and ED stay longer than 24 hours before admission.
Data collection
Eligible patients were enrolled in the study beginning at the ED visit. The following factors were determined pre-event and postdischarge: demographics (sex and age), socioeconomic variables (residence by urbanization level [7], education level, occupation, and insurance status), behavioral variables (smoking status, alcohol consumption, and exercise), co-morbidities (diabetes, hypertension, dyslipidemia, chronic kidney disease, chronic heart disease, and cerebrovascular disease), time variables (season, week, and time of the event), clinical presentation, chief complaints (mental status change, weakness, sensory change, gait disturbance, dizziness, cardiac arrest, headache and others), hospital diagnosis (primary ICH or secondary ICH), operation and embolization, hospital mortality, and disability using the modified Rankin Scale (0=no symptoms, 1=no significant disability, 2=slight disability, 3=moderate disability, 4=moderately severe disability, 5=severe disability, 6=dead). The physician in the ED obtained basic information from medical records, and the attending neurosurgeon or neurologist recorded the discharge summary.
The information was collected at admission and study co-investigators collected basic information for each variable, using a designed case report registry. After primary data collection, the study coordinators of each hospital reviewed the registry, corrected erroneous information, and uploaded the information to the web-based registry system operated by the Korea Centers for Disease Control and Prevention. The data quality management process detected errors, provided feedback to each participating ED, and revised the information. Monthly data quality management meetings and discussions were performed in order to maintain data quality.
The independent variables were the type of ED arrival by EMS use and inter-hospital transfer. We divided the patients into four groups based on the use of EMS and inter-hospital transfer: direct visit by EMS (EMS-direct), direct visit without EMS (non-EMS-direct), transferred from a primary hospital by EMS (EMS-transfer), and transferred from a primary hospital without EMS (non-EMS-transfer).
Outcome measures
The outcomes were the proportion of participants with a time interval within one hour from symptom onset to ED arrival at the definitive care hospital (S2ED) and those with a time interval of within four hours from symptom onset to admission to the definitive care hospital (S2AD). We used four hours as the cut-off for the time to provide definitive care based on pathophysiological status [8]. Mechanical disruption of the neurons and glia is initiated after one hour, and a secondary cascade of injury after ICH is mediated by the products of coagulation and hemoglobin breakdown, particularly thrombin, which activates microglia within four hours after injury. Activated microglia release products that induce the breakdown of the blood–brain barrier, vasogenic edema, and the apoptosis of neurons and glia. We hypothesized that S2ED within one hour and S2AD within four hours are clinically important for preventing additional injury after ICH.
Ethics statement
The study was reviewed and approved by institutional review board in Seoul National University Hospital (h-1012-134-346). The informed consent was waived.
Statistical analyses
A multivariate logistic regression was performed to calculate the effect size of the type of arrival classified by EMS and inter-hospital transfer. We developed three models: 1) model 1, adjusted for sex and age; 2) model 2, adjusted for sex, age, socioeconomic factors (e.g., urbanization, education level, occupation, and insurance), behavioral factors (exercise, smoking status, and alcohol consumption), and chronic comorbidities (diabetes, hypertension, dyslipidemia, chronic kidney disease, chronic heart disease, and cerebrovascular disease); and 3) model 3, adjusted for sex, age, socioeconomic factors, behavioral factors, chronic comorbidities, time variables (season, week, and time of event), clinical presentation symptoms (mental status change, weakness, sensory change, gait disturbance, dizziness, cardiac arrest, headache, and other symptoms), and the type of ICH (primary, secondary, and unknown). We performed an interaction model analysis to test the interhospital transfer effect for each EMS utilization group. We calculated the adjusted odds ratios (AORs) and 95% confidence intervals (CIs) from the above models in order to measure the effect size.
RESULTS
A total of 9,766 candidates visited participating hospitals during the study period (Fig. 1). Of these patients, 511 were excluded from participation for symptom onset more than seven days prior to presentation; 395 patients were excluded because no record existed of EMS use; 38 patients were excluded because hemorrhagic stroke occurred after thrombolysis for ischemic stroke; 103 patients were excluded because they were younger than 18 years of age; 1,787 patients were excluded because they were discharged or transferred to another hospital from the ED without definitive care; and 103 patients were excluded because the period between symptom onset and admission was more than one day due to administrative reasons or overcrowding. Finally, a total of 6,564 patients were enrolled in the study. Of these patients, 2,968 used EMS (EMS group) and 3,596 did not (non-EMS group); 2,481 patients in the EMS group visited the definitive care hospital directly (EMS-direct group) and 487 patients visited a primary hospital with EMS first and were then transferred to the definitive care hospital ED for additional evaluation and management (EMS-transfer group). Of the 3,596 patients who did not use EMS, 1,572 visited the definitive care hospital directly (non-EMS-direct); the remaining 2,024 patients visited the primary hospital and were then transferred for additional evaluation and management (non-EMS-transfer group).
Patient flow. EMS, emergency medical services; EMS-direct, direct visit by EMS; non-EMS-direct, direct visit without EMS; EMS-transfer, transferred from a primary hospital by EMS; non-EMS-transfer, transferred from a primary hospital without EMS.
Table 1 shows the baseline characteristics of the sample. Demographic findings differed significantly across the groups. Table 2 presents the clinical presentations and outcomes. The EMS-direct and EMS-transfer groups had higher incidences of critical clinical conditions, including higher rates of mental status changes (52.4% and 65.1%, respectively) and cardiac arrest (0.9% and 0.2%, respectively), whereas the non-EMS-direct and non-EMS-transfer groups showed less severe conditions, such as sensory changes (17.9% and 15.1%, respectively) and dizziness (15.5% and 15.2%, respectively). Disability at discharge by modified Rankin Scale was much higher among the EMS groups than among the non-EMS groups. The hospital mortality rate ranged from approximately 18.0% to 18.5% within each EMS group but ranged from 7.1% to 10.6% within the non-EMS groups.
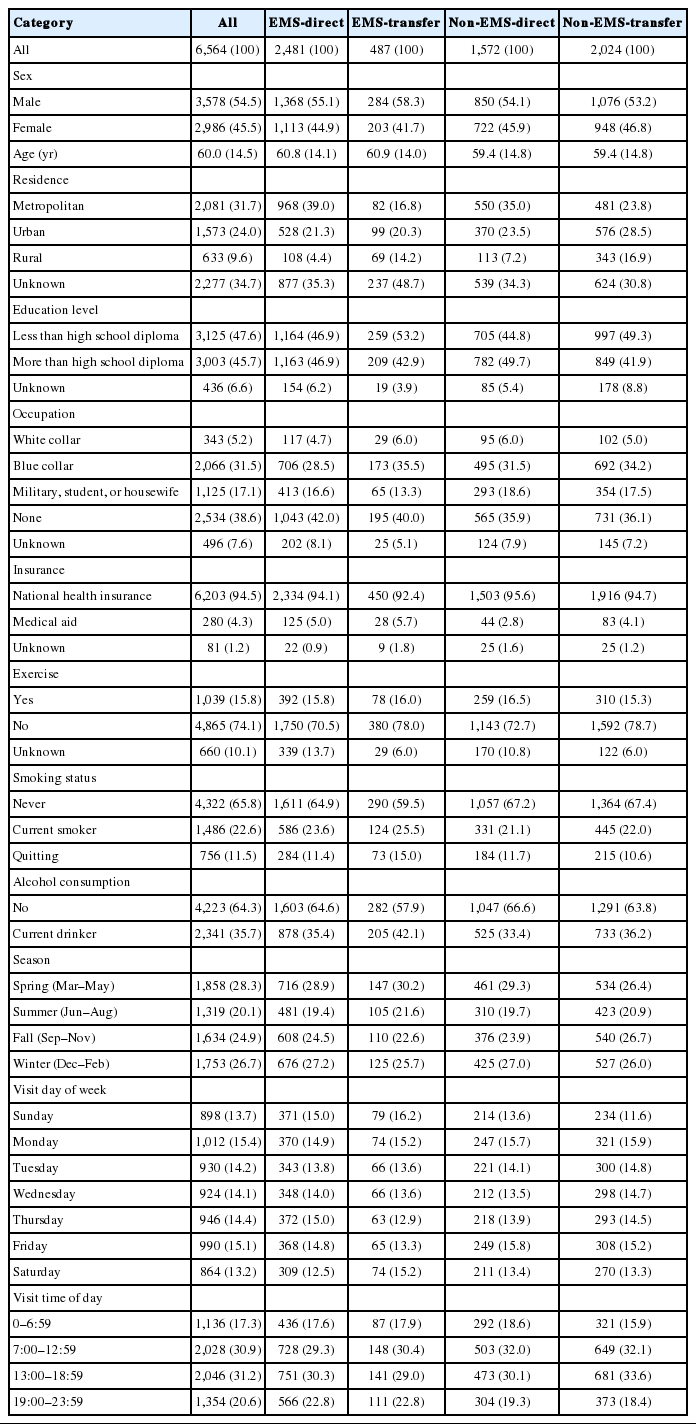
Sample demographics
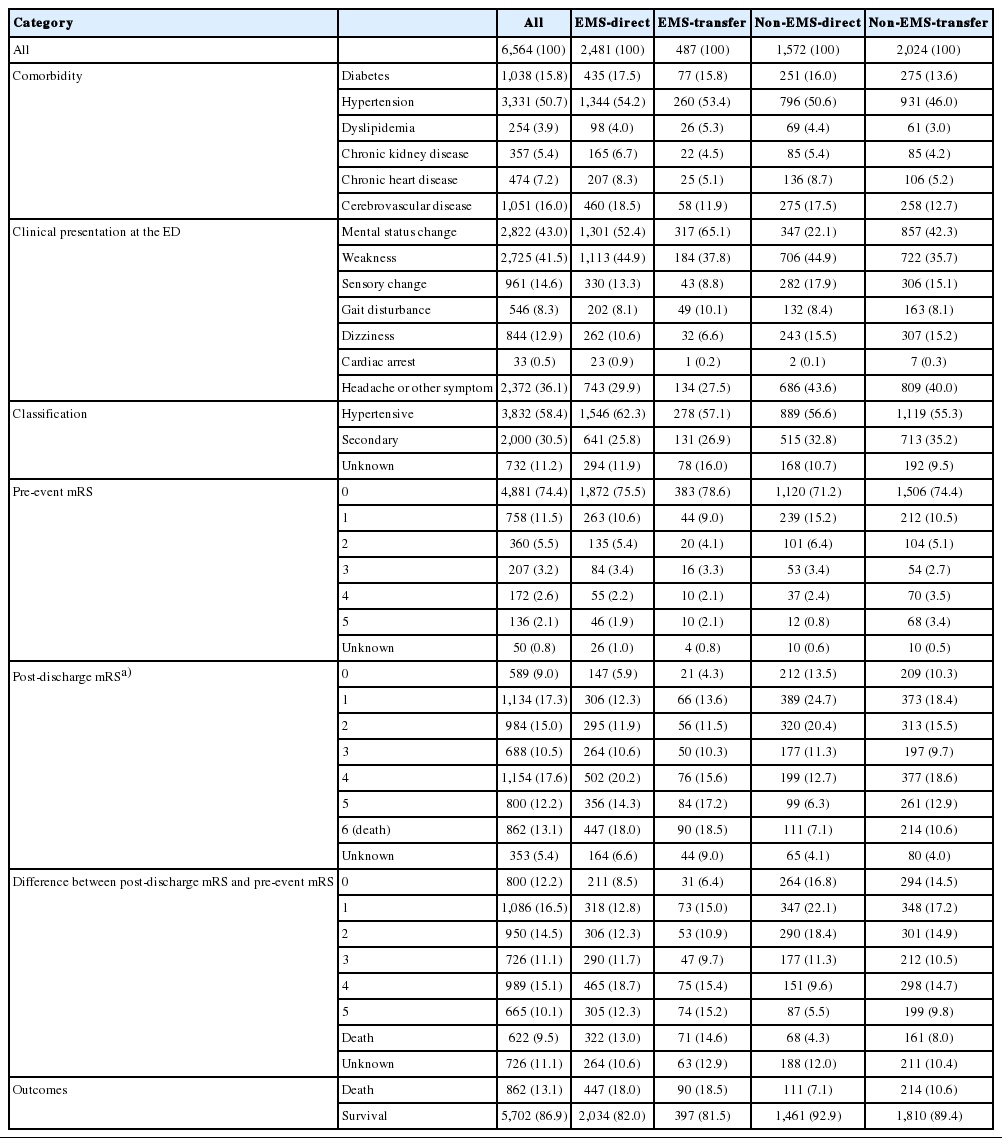
Clinical symptoms at presentation and outcomes
Table 3 shows that S2ED and S2AD were much shorter for the EMS-direct group than for the other groups. The proportion of the EMS-direct group with S2ED within one hour was 45.7%, whereas the proportions of the EMS-transfer, non-EMS-direct, and non-EMS-transfer groups were 4.3%, 21.1%, and 3.5%, respectively. The proportion of the EMS-direct group with S2AD was 44.5%, whereas the proportions of the EMS-transfer, non-EMS-direct, and non-EMS-transfer groups were 13.3%, 22.2%, and 11.8%, respectively.

Proportions of time interval outcomes by group
Table 4 shows the AORs from each model (adjusted for potential confounders). The AORs (95% CIs) in model 3, which was adjusted for the greatest number of confounding variables, were significantly higher for the EMS-direct and non-EMS direct groups than for the non-EMS-transfer group: 5.56 (4.70 to 6.56) and 2.35 (1.94 to 2.84) for S2AD and 22.95 (17.73 to 29.72) and 7.95 (6.04 to 10.46) for S2ED, respectively. However, the EMS-transfer group did not show differences in S2AD or S2ED.

Multivariate logistic regression analysis for S2AD and S2ED by group, EMS use, and inter-facility transfer
Table 5 shows that the effect of EMS use significantly differed with regard to inter-hospital transfer. The AORs (95% CIs) from the interaction model showed a significant effect among patients who did not undergo inter-hospital transfer: 2.36 (2.03 to 2.76) for S2AD and 2.89 (2.47 to 3.38) for S2ED. However, EMS use did not have a significant effect in the inter-hospital transfer groups: 0.96 (0.71 to 3.05) for S2AD and 1.11 (0.67 to 1.84) for S2ED.

Multivariate logistic regression analysis of the time interval between S2AD and S2ED among patients with intracerebral hemorrhage by EMS use with an interaction between EMS use and inter-hospital transfer
DISCUSSION
The current study found significant differences in effects according to arrival mode (e.g., EMS and inter-hospital transfer) among ICH patients, particularly with decreased time interval from symptom onset to definitive care. This study also found a significant effect when patients were directly transported via EMS to the definitive hospital; however, there did not appear to be an advantage when patients were transported to a primary hospital via EMS and then transferred to the definitive hospital. The findings about the effect of inter-hospital transfer among ICH patients are consistent with those of previous studies [9,10]. Another recent study reported that EMS transport was associated with lower hospital mortality and disability after acute hemorrhagic stroke according to ED length of stay [11]. These results provide a new and critical example of a regionalized model for improving the performance of emergency care and saving the lives of more patients with ICH. There is a lack of evidence that providing critically important interventions within the time limitations associated with ICH is beneficial, unlike timely fibrinolysis in ischemic stroke. Typically, ICH can be managed with various treatment options depending on patient characteristics and disease severity. No definitive care timeline guidelines have been established for patients with ICH.
Recent studies on the association between time intervals and clinical outcomes have been conducted. The observation that substantial ongoing bleeding in patients with ICH is linked to neurological deterioration (particularly during the first 3 to 4 hours after onset) dramatically changed the prospects of effective ICH treatment [12]. This observation prompted the use of activated factor VII among patients with spontaneous ICH within the first hours after symptom onset [13,14]. This finding also renewed interest in controlling blood pressure to decrease the serious effects of ICH during the first hours after onset [15,16]. The results of the previous INTERACT2 (Patient Admission Intensive Blood Pressure Reduction in Acute Cerebral Hemorrhage Trial 2) trial showed improved functional outcomes with an intensive lowering of blood pressure [17]. The patients in that trial were administered a blood-pressure-lowering agent within one hour from randomization that could be initiated within six hours after the onset of spontaneous ICH [18]. Pathophysiologically, hematomas induced by ICH cause mechanical injury to neurons and glia, followed by mechanical deformation that causes neurotransmitter release, mitochondrial dysfunction, and membrane depolarization. These reactions cause mechanical stretching of neurons and glia, mitochondrial failure, and cytotoxic necrosis by four hours after injury [19-22]. In other words, cascades that occur during the first four hours are related to the direct effect of the hematoma itself, and subsequent events are related to the products released from the hematomas. The pathological processes that occur four hours after hemorrhage are often irreversible. Therefore, initiating treatment with a blood pressure-lowering agent after hospital admission might be critically important [8]. Thus, target outcomes should be set in this study as surrogates that measure the proportion of early hospital arrival and timely admission from symptom onset, assuming that the definitive treatment will be started in time.
Early intervention for ICH can be divided into three categories; bleeding control [13], surgical intervention [23], and control of elevated blood pressure [24]. In clinical practice, however, early intervention cannot ensure clinical improvement, despite reaching treatment goals targeting a single physiological parameter within a reasonable period of time [25]. If patients arrive within the golden hour, during which time there can be promising results from treatment, then optimal therapeutic options can be provided; however, when patients arrive later, the effectiveness of treatment care is suboptimal, and poor outcomes can result.
Patient, prehospital, and hospital delays are the three major reasons for delayed hospital treatment of ICH. First, individual differences exist in recognizing the physical symptoms of ICH. Some people recognize headaches as a trivial symptom and do not seek medical care, whereas others worry and visit the hospital at symptom onset. Occasionally, an individual’s educational status also affects the time delay to hospital arrival. More well-educated people have more health information. When patients have more information regarding stroke, they are more likely to seek medical advice. One of the most important public education and advocacy initiatives is to encourage people to call EMS when they experience or observe a neurological symptom. The current study found that EMS use shortens the time to arrival at a definitive care hospital. The first step to receive stroke care is to call EMS. Many barriers prohibit individuals from calling EMS for stroke symptoms [26]. In the current study, women and people with low education levels were commonly observed in the non-EMS group.
Pathophysiological factors can also cause time delays in hospital arrival. Because the classic presentations of ICH are rapid-onset neurological deficits, decreased consciousness, and signs of brainstem dysfunction, patients cannot access medical help unless a witness is nearby. Bystander education is a critical component to shorten the time to receiving definitive care. In particular, family members are encouraged to call EMS when patients display neurological symptoms. In this study, the most common symptom among the EMS-direct group was mental status change, whereas simple sensory changes or headaches were most common among the non-EMS group.
The second reason for the time delay occurs during the prehospital stage. As listed in Table 1, S2ED and S2AD were shorter in the EMS-direct and non-EMS-direct groups than in the EMS-transfer and non-EMS-transfer groups. Distinguishing ischemic stroke from ICH is difficult without CT scans, which can only be performed in a hospital. If patients who are suspected of stroke are transferred to a local hospital by EMS and then diagnosed with ICH, they must then be transferred again to a definitive care hospital. The results of the current study suggest that delaying the recognition of ICH during the prehospital stage affects the time interval to definitive treatment. EMS providers should regard all stroke symptoms as ischemic strokes because there is not yet a way for hemorrhagic stroke to be diagnosed in the field. To shorten the time to definitive care, EMS providers are encouraged to use the prehospital stroke scale to identify potential cases suitable for fibrinolysis [27,28].
Finally, hospital-stage delays in brain imaging occur in overcrowded EDs. EDs are overcrowded worldwide [29,30]. Overcrowding causes delays in CT or magnetic resonance (MR) imaging, which subsequently slow diagnosis and admission. ED overcrowding requires additional evaluation and interventions. EMS providers should give advance notice to the ED of the impending arrival of a potential stroke patient, so that critical pathways can be initiated and consulting services can be alerted. Advance notice by the EMS significantly shortens the time to CT scanning, especially in overcrowded EDs [3,6].
This study has certain limitations. The primary outcome of the current study was arrival within 1 hour and admission within 4 hours after symptom onset. These parameters were merely surrogate markers and did not denote the actual beginning of definitive treatment. Therefore, this discrepancy cannot reflect actual intracranial pathophysiology.
The primary purpose of this study was to determine the relationship between EMS use and hospital arrival/admission time. The causes of mortality and functional outcome improvements in patients with ICH are multifactorial. Although EMS use is related to early hospital arrival and admission, the results of the current study do not guarantee that EMS use increases patient survival or improves functional outcome. Additional research is needed to identify the relationship between EMS use and survival rates or neurological functioning.
This study has basic statistical limitations. First, the patients enrolled in this study do not represent the general population. Second, we excluded patients who did not provide information regarding their EMS use and those transferred from the ED without receiving definitive care. These exclusions might create bias with regard to the association between EMS use and timeliness of hospital arrival or admission. Third, the multivariate logistic regression was adjusted for potential confounders; however, other confounders (e.g., EMS resources) were not measured.
In summary, EMS use can reduce the time to ED arrival and admission at the definitive care hospital via direct transport to definitive care among patients with hemorrhagic stroke. However, patients who were transported to a primary hospital by EMS and then transferred again to the definitive hospital did not benefit from a brief time interval to definitive care.
Notes
No potential conflict of interest relevant to this article was reported.
Acknowledgements
The Korean Centers for Disease Control and Prevention (2008-2012) funded this study
References
Article information Continued
Notes
Capsule Summary
What is already known
Advance notice by the emergency medical service significantly shortens the time to computed tomography scanning in the emergency department. Emergency medical service use is a strong driving force for the early diagnosis and goal-directed treatment of intracerebral hemorrhage.
What is new in the current study
This study evaluated how emergency medical service use influences the arrival and admission time of patients with intracerebral hemorrhage to a definitive care hospital. We used patient arrival and admission times as surrogate markers for the time to final management, which ultimately lead to favorable outcomes.