Emergency medicine physicians infrequently perform pediatric critical procedures: a national perspective
Article information

Abstract
Objective
To our knowledge, this is the first comprehensive study using a nationally representative database to estimate the frequency of critical procedures (endotracheal tube intubation [ETI], cardiopulmonary resuscitation [CPR], and central line insertion [CLI]) in children and adults.
Methods
The study was based on the secondary analysis of the 2010-2014 National Hospital Ambulatory Medical Care Survey. We included adult and pediatric patients undergoing critical procedures in the emergency department. We extracted demographic and clinical information, including the performance of critical procedures. For frequent procedures (≥1 per year), we estimated the annual number of critical procedures per emergency physician (EP) by dividing the total number of annual critical procedures by the total number of EPs (estimated at 40,000). For infrequent procedures, we calculated the average interval between procedures. We summarized the data with descriptive statistics and 95% confidence intervals (CIs).
Results
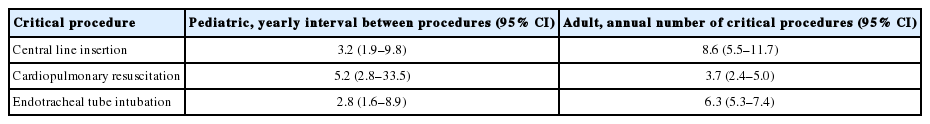
There were an estimated 668 million total emergency department visits (24% pediatric). On average, a single EP performed 8.6 (95% CI, 5.5 to 11.7) CLIs, 3.7 (95% CI, 2.4 to 5.0) CPRs, and 6.3 (95% CI, 5.3 to 7.4) ETIs per year in adults. In comparison, a single EP performed one pediatric CLI, CPR, and ETI every 3.2 (95% CI, 1.9 to 9.8), 5.2 (95% CI, 2.8 to 33.5), and 2.8 (95% CI, 1.6 to 8.9) years, respectively.
Conclusion
Our nationwide findings confirm those of previous smaller studies that critical procedures are significantly fewer in children than adults. We suggest that methods to retain skills in pediatric critical procedures should be developed for general EPs to ensure that they deliver the highest level of care across the entire age spectrum.
INTRODUCTION
Approximately 85% of children in the United States who receive emergency care are treated at general emergency departments (EDs) staffed by general emergency physicians (EPs) [1]. Often, pediatric specialists are not available in all hospitals due to a limited workforce [2]. It is the general belief that the majority of general EPs have limited exposure to supervising and performing critical procedures on children. A 2015 Australasian study found that 83% of full-time general EPs did not perform a single pediatric critical procedure during their 12-month study period [3]. Although infrequent, these critical procedures are often critical in the acute stabilization and treatment of a pediatric patient. Due to limited exposure, general EPs have been reported to have low confidence when handling pediatric and neonatal emergencies [4].
Fewer opportunities to practice critical skills can have harmful implications leading to higher morbidity and mortality in children. Endotracheal tube intubation (ETI) is a common critical procedure in adults but occurs less frequently in pediatric patients [5]. Since emergency airway situations are relatively rare in children, general EPs often have less practice, and may be inadequately prepared for emergency airway situations in younger patients, especially infants [3]. Pediatric patients often have faster oxygen desaturation; therefore, they have worse outcomes than adults if ETI is not successful on the first attempt [6].
Alongside oral intubation, the ability to effectively resuscitate a critically ill child requires competence in cardiac arrest management as well as advanced vascular access. Central venous catheterization has many utilities, including rapid fluid infusion, administering hyperosmolar medications, and hemodynamic monitoring. Invasive procedures and cardiopulmonary resuscitation (CPR), if not performed properly, may increase the risk of complications and the total number of hospital admissions.
Prior studies on pediatric critical procedures in EDs have been limited to single or a few sites [3,5,7]. Therefore, the aim of this study was to determine the frequency of critical procedures performed by general EPs in both adult and pediatric patients using a nationally representative database. We focus specifically on central line insertion (CLI), CPR, and ETI.
METHODS
Study design
We conducted a retrospective, population-based, cross-sectional study using the nationally representative 2010–2014 National Hospital Ambulatory Medical Care Survey (NHAMCS) to evaluate the information on both adult and pediatric (<19 years old) patients who underwent a critical procedure in EDs. NHAMCS is a publicly available dataset that does not contain patient-identifiable information. This study was, therefore, determined to be exempt from full review by the institutional review board at our institution.
Survey details
The NHAMCS is an annual survey designed by the National Center for Health Statistics and administered by the US Census Bureau. The NHAMCS data comprises the use and provision of ambulatory care services in hospital emergency and outpatient departments. In this study, only data related to ED visits were analyzed, that is, reports from approximately 400 nationally representative hospital EDs on a random sample of patient visits annually. The range of hospitals sampled in the survey comprises non-institutional general and short-stay hospitals and federal, military, and veterans administration hospitals located in the United States. The weighted 4-stage probability sample allows for extrapolation of national estimates from primary sampling units in all 50 states and the District of Columbia. The US Bureau of the Census acts as the data collection agent for the NHAMCS and trains hospital staff at each sampled ED to collect data, while field representatives review the case report forms to ensure data quality. A detailed description of the NHAMCS, including sample design, data collection procedures, field quality control, data processing, and estimation procedures are available on the National Center for Health Statistics website [8].
Study population
For the purpose of this study, we selected ED visits between 2010 and 2014 by adult and pediatric patients (<19 years old) who underwent a critical procedure. The critical procedures evaluated were CLI, CPR, and ETI.
Measures
We examined the following primary visit variables: patient demographics (age, sex, race/ethnicity, and insurance type), arrival by ambulance, diagnosis classification, hospital geographic characteristics, healthcare provider seen, and patient disposition. Patient race (white, black, and Asian) and ethnicity (Hispanic or non-Hispanic) were determined based on standard practices at each surveyed hospital. In the categorization of race, there were small sample sizes for Native Hawaiian or other Pacific Islanders, Alaskan natives or American indians, and other less common racial groups. The “unspecified” categorization of race and ethnicity accounts for individuals who did not self-identify or who identify with multiple racial and ethnic groups. In the categorization of insurance, we classified patient visits as having private insurance, public insurance (Medicare or Medicaid), self-pay, or other sources (combining no charge, charity care, workman’s compensation, etc.). For diagnosis classification, we used the International classification of diseases, ninth revision (ICD-9). We included all visits with any of the following ICD-9 diagnosis codes as the primary, secondary, or tertiary diagnosis: 001–139 (infectious or parasitic diseases), 390–459 (diseases of the circulatory system), 460–519 (diseases of the respiratory system), 800–959 and 990–999 (trauma excluding poisons or toxins), and 960–989 (poison or toxin related). The list of healthcare providers in the EDs included attending physician, resident or intern physician, nurse practitioner, and physician assistant. Admission to either a critical care unit or operating room was used to identify patients with particularly severe presentations that underwent a critical procedure in an ED. The identification of patients who died in the ED or after admission also provided a broader understanding of patient severity.
Outcomes
Regarding the performance of critical procedures, we focused on CLI, CPR, and ETI in both adult and pediatric patients. For frequent procedures (≥1 per year), we estimated the annual number of critical procedures per EP by dividing the total number of annual critical procedures in both children and adults by the estimated number of practicing EPs in the United States. For infrequent procedures (<1 per year), we calculated the average yearly interval between procedures by taking the reciprocal between the total number of annual procedures and the total number of EPs nationally. We assumed procedures were evenly distributed among all EPs. In 2015, the Association of American Medical Colleges data reports gave an estimated number of active EPs in the US to be approximately 40,000 [9].
Data analysis
Using IBM SPSS Statistics ver. 23.0 (IBM Corp., Armonk, NY, USA), we summarized the data using descriptive statistics and 95% confidence intervals (CIs) to account for the survey sampling methodology.
RESULTS
There were an estimated 668.8 million total ED visits nationally for the 5-year (2010 to 2014) survey period. From these, approximately 24% (157.6 million) were visits by pediatric patients.
Annually, this accounts for 133.8 million visits to EDs with 32 million visits for pediatric presentations. Annually, there were an estimated 356,220 CLIs, 156,386 CPRs, and 268,227 ETIs performed in the EDs (Table 1). They accounted for approximately 0.3% (CLI), 0.1% (CPR) and 0.2% (ETI) of all ED visits within the 5-year study period. Of the total number of annual CLIs, 343,792 (96.5%) were performed in adults, while only 12,428 (3.5%) were performed in pediatric patients. Regarding the total annual number of CPR administrations, 148,637 (95.0%) cases were in adults and 7,749 (5%) cases in children. Lastly, out of the total number of estimated annual ETIs, 253,706 (94.6%) were in adults and 14,521 (5.4%) in children.

Annual number of critical procedures performed nationally in adult and pediatric patients by emergency physicians
Based on the above results, we estimate that every year each EP performs on average 8.6 (95% CI, 5.5 to 11.7) CLIs, 3.7 (95% CI, 2.4 to 5.0) CPRs, and 6.3 (95% CI, 5.3 to 7.4) ETIs in adults (Table 2). In contrast, we estimate that each EP places a central line only once every 3.2 (95% CI, 1.9 to 9.8) years, places an endotracheal tube only once every 2.8 (95% CI, 1.6 to 8.9) years, and performs CPR once every 5.2 (95% CI, 2.8 to 33.5) years in children.
Frequency of critical procedures performed in adult and pediatric patients by a single emergency physician
CLI
We estimated that 1,718,960 adult patients and 62,140 pediatric patients underwent a CLI in an ED over the 5-year survey period (Table 3). On average, the pediatric patients were 10 years old and the majority identified as male (56%). In comparison, the mean age of adult patients was 57 years with only 42% being male. A large portion of patients in both groups was white (45% pediatric vs. 49% adult). The majority of pediatric patients listed their ethnicity as “unspecified” (62%) while most adults (64%) identified their ethnicity as non-Hispanic/Latino. Pediatric patients were more likely to have private health insurance (41%), while adult patients were more likely to be Medicare recipients (41%). A significant proportion of pediatric (32%) and adult (51%) patients who received a central line in an ED was brought in by ambulance. Almost all pediatric (96%) and adult (97%) patients were seen by an attending physician in the EDs. The majority of central lines were placed in children living on the West Coast (32%) and Midwest (43%). In contrast, the regional distribution in CLIs in adults was relatively even. Patients with a central line placed who were subsequently admitted (18% pediatric vs. 56% adult) were brought to critical care units (72% pediatric vs. 50% adult). Only a small proportion of patients died in the EDs after central line placement (0% pediatric vs. 3% adult).

Demographics and outcomes of pediatric and adult patients who underwent a central line insertion in an emergency department in 2010–2014
Cardiopulmonary resuscitation
An estimated 38,747 pediatric and 743,185 adult patients received CPR in an ED over the 5-year survey period (Table 4). Pediatric patients had a mean age of 4 years while adults were on average 63 years old. Both groups were predominantly male (65% pediatric vs. 61% adult). Interestingly, only 29% of pediatric patients were white and 31% were black. In the adult population, most patients were white (76%). Half of the adult patients were on Medicare, while 40% of pediatric patient families were paying out of pocket for health expenses. A large portion of these patients was brought in by ambulance (86% pediatric vs. 75% adult) prior to CPR administration in an ED. Not surprisingly, both pediatric (74%) and adult (60%) patients were mostly diagnosed with a disease of the circulatory system. Most patients were seen by an attending physician (96% pediatric vs. 86% adult), and only a small portion of patients was seen by a resident or intern physician. Compared with CLI patients, CPR patients were more likely to die in the ED (21% pediatric vs. 44% adult). Most adults who were admitted (24%) following CPR were taken to critical care units (81%). Approximately half of all pediatric and adult patients admitted were alive at discharge (56% pediatric vs. 43% adult).
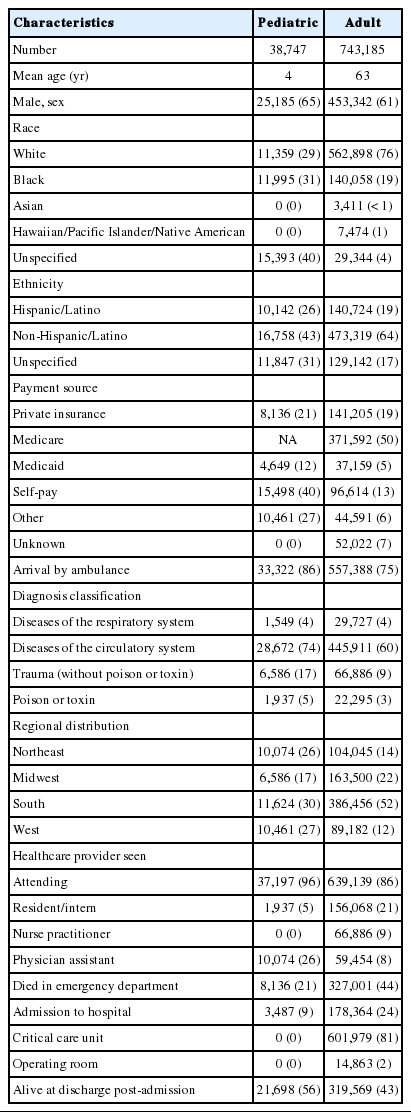
Demographics and outcomes of pediatric and adult patients who underwent cardiopulmonary resuscitation in an emergency department in 2010–2014
Endotracheal intubation
Between 2010 and 2014 there were an estimated 72,608 pediatric patients and 1,268,530 adult patients who received an ETI in an ED (Table 5). The average age of these patients was 5 years in children and 61 years in adults. Both patient populations were primarily male (78% pediatric vs. 56% adult), white, and non-Hispanic/Latino. Seventy-four percent of pediatric patients were on Medicaid, while 51% of adults were Medicare recipients. Both patient populations primarily arrived by ambulance (74% pediatric vs. 88% adult) prior to intubation in the ED. Trauma without poison or toxin accounted for 37% of pediatric patients who were intubated, while diseases of the circulatory system accounted for 35% of adult patients. The largest percentage of ETIs occurred in the South (40% pediatric vs. 33% adult). Nearly all patients intubated were seen by an attending physician (96% pediatric vs. 98% adult). Resident or intern physicians saw approximately 33% of pediatric patients and only 21% of adult patients. Following the ETI, 33% of pediatric and 64% of adult patients were admitted, and most were sent to critical care units (78% pediatric vs. 83% adult).

Demographics and outcomes of pediatric and adult patients who underwent an endotracheal tube intubation in an emergency department in 2010–2014
DISCUSSION
Currently, we are unaware of any studies that have assessed the frequency of critical procedures performed in both adults and children using a nationally representative database. Through this comprehensive national study, we are able to confirm the findings of previous smaller reports comparing procedures in pediatric and adult patients, that pediatric critical procedures were performed at a significantly lower rate by general EPs [3,7]. We expand on existing research by providing national estimates of the frequency of critical procedures performed in both children and adults.
The critical procedures evaluated in this study constitute a minority of all ED visits, and yet we were surprised to find that the average general EP does not perform a single critical procedure on children in a given year. In fact, the average general EP places a central line and performs an ETI on children approximately once every 3 years. An even longer interval of approximately once every 5 years was found for cardiopulmonary resuscitation performed on pediatric patients by general EPs.
The competent performance of critical procedures is paramount to the effective intubation and resuscitation of the critically ill child. Since pediatric critical procedures are infrequent in general EDs, EPs may not become competent in these procedures. We speculate that the lack of frequency may partially contribute to the high degree of discomfort among EPs in performing these life-saving procedures. Indeed, a previous survey of EPs found that over 25% of them were uncomfortable performing certain potentially life-saving pediatric procedures, including oral intubation [10].
Compromised airways in children can cause significant morbidity and mortality, and are primarily managed by ETIs [11]. Similarly to previous studies, our study found that the most frequent indications for pediatric ETIs were diseases of the respiratory system (27%) and blunt trauma (37%) [5]. In contrast, the most frequent indications for adult intubation were of cardiovascular etiology (35%). Both age groups had high mortality rates following intubation, most likely due to the severity of illness in patients requiring ETI.
Fewer opportunities to practice airway management in children pose significant challenges for EPs to be adequately prepared for a pediatric emergency airway situation. There is still no clear consensus regarding the number of intubations that need to be performed to be competent nor the number needed to maintain competency in both pediatric and adult patients [12]. There is an anatomical/physiological difference in the structure of the airway in children that make intubation more challenging than in adults [5]. Moreover, compared with adults, pediatric patients desaturate more rapidly and have poorer outcomes if ETI is not successful on the first attempt [6]. Also, first intubation attempts in pediatric patients have a relatively high failure rate [5]. Therefore, EPs with infrequent exposure to oral intubation in children may require multiple attempts to secure the airway. Thus, the high pediatric mortality rate we observed in the EDs following ETI may have resulted from hypoxia or hypotension secondary to intubation failure after multiple attempts were made [13,14].
Contrary to the other critical procedures, CPR is an expected skill for all providers in EDs, regardless of their role. Multiple studies have demonstrated that the skills obtained during CPR training often decay as rapidly as within a few months [15]. This, in combination with infrequent exposure to cardiac arrest in pediatric patients in the ED, can severely diminish the quality of CPR. We found that EPs perform CPR on adults approximately 4 times a year and only once every 5 years in children. Thus, skill maintenance in pediatric CPR among attending physicians can be challenging given that the events themselves are so uncommon. As attending physicians are more often in the role of code leader or CPR coach, it is imperative that they demonstrate and instruct high-quality CPR given its association with survival outcomes [16-18]. In our study, the majority of patients requiring CPR were in critical condition with a pre-existing cardiovascular disease and were brought in by ambulance (86% pediatric vs. 75% adult). A high mortality rate among pediatric patients was witnessed in the EDs (21%).
Central venous catheters or central lines are often essential for therapeutic and diagnostic interventions in pediatric patients. Unfortunately, the proper placement and usage of central lines are not without risk. CLI in children is considered a challenging procedure, even when ultrasound guidance is used [19]. We found that, on average, EPs place a central line approximately 9 times a year in adults and only once every 3.2 years in children. This lack of consistent exposure to pediatric CLIs in the ED is likely to affect physician confidence and proficiency in performing this invasive procedure. The lengthy interval between insertions in children may decrease practitioners’ cognitive level of the procedure alongside their practical skills. Studies suggest that if more than two venipunctures are made in the attempt to access the central vein, complications are more likely to occur [20,21]. Multiple insertion attempts and poor insertion technique, a reflection of inexperience, have been associated with complications including vascular or cardiac erosion, tamponade, arrhythmia, thrombosis, and infection [22-24]. In addition, catheter-related bloodstream infections resulting from trauma, likely due to multiple attempts, have been associated with increased hospital admission, morbidity, mortality, and financial burden [25-27].
Given the infrequency of pediatric critical procedures negatively affecting EPs’ competency, the fundamental question remains– are EPs being educated properly? Despite continued efforts to determine whether existing training approaches are able to produce competence, there is still no clear consensus on the best method to accomplish and maintain competence [28-31]. Studies have shown that physicians-in-training report procedural training to be inadequate due to the central issue of poor supervision [7,32-34]. In this study, only a small percentage of patients who underwent a critical procedure was seen by a resident or intern. Only 20% of patients (adult and pediatric) who had a central line placed were seen by a resident physician. For patients who underwent CPR only 5% of children and 21% of adults were seen by a resident. This percentage is higher in patients with an ETI, where residents saw 33% of children and 21% of adults. In contrast, attending physicians saw between 86%-98% of patients for each critical procedure. One explanation for these figures is that not all hospitals and community sites surveyed had residency programs at their institution. When residents do have the opportunity to perform the critical procedure, it often results in higher complication rates than when more senior physicians perform the procedure [35,36]. The data from this study provide strong evidence that both residents and attending physicians have very little exposure to pediatric critical procedures in EDs.
Skill decay is a possibility for all EPs given the low frequency of pediatric critical procedures in EDs. In fact, even if ED clinical hours per physician were to be increased, it would not suffice to improve exposure. Although there are no standard methods for assessing the competence of the practitioner, multiple learning modalities, such as simulation or practice in the OR, are currently being used to supplement clinical experience [19,37,38]. Interestingly, simulation-based education with continual practice has been shown to be more effective than traditional clinical skill acquisition [39].
This study has notable limitations. Although the NHAMCS data offers a nationally representative sample, it is possible that coding and sampling errors may have led to over- or underestimation of specific diagnoses. In addition, NHAMCS may include inaccuracies in self-reported data fields, such as payment source [40]. Also, the number of critical procedures performed at each hospital may have been under-coded with more procedures actually being performed. Given that these critical procedures occur so infrequently and yet with high acuity, it is likely that these events were successfully recorded. However, it was difficult to ascertain from the survey data the level of ED staff performing each procedure. For example, the type of physician (e.g., anesthesiologist, neonatal physician) or other healthcare providers (e.g., respiratory therapist) was not listed in the database. Nevertheless, studies have suggested that general EPs perform 82% to 98% of ED intubations with anesthesiologists being consulted only for patients with difficult airways [41,42]. Regarding CPR, the presence of a physician may be harder to determine since the majority of healthcare providers engage in this procedure. Furthermore, the national database provides limited details on each critical procedure performed. We were unable to determine the average attempts per critical procedure or whether the procedure succeeded or failed. Lastly, the database does not provide information on the volume of the ED nor the severity of the patients, both of which may have influenced the frequency of critical procedures performed.
In summary, previous studies on critical procedures have been limited to a certain geographical area with reported data from single or multiple hospital sites. This comprehensive national study, in agreement with prior studies, confirms that EPs have limited opportunities to perform pediatric critical procedures in EDs across the United States. Expanding on existing research, our study provided national estimates of the frequency of critical procedures performed in both pediatric and adult patients. The infrequency of these critical procedures places all EPs, from attending physicians to resident-level physicians, at risk of skill deterioration and of inability to maintain procedural competency. Our results, together with those published previously, re-emphasize the need for exploring alternative methods to retain pediatric critical skills, which serve the most vulnerable patients seen in general EDs. Alternative learning modalities, such as simulation, must be sought out to enhance physician education. Lastly, quality assurance systems centered on the performance of critical procedures in children should be established within EDs to ensure the highest level of patient care and adequate physician training.
Notes
Adam J. Singer is the editor-in-chief of Clinical Experimental Emergency Medicine; however, he was not involved in the peer reviewer selection, evaluation, or decision process of this article. No other potential conflicts of interest relevant to this article were reported.
References
Article information Continued
Notes
Capsule Summary
What is already known
It is the general belief that the majority of general emergency department (ED) physicians have limited exposure to supervising and performing critical procedures on children. Prior studies on critical procedures have been limited to single or multiple sites within a geographic location.
What is new in the current study
This comprehensive national study confirms prior research conducted on single and multiple hospital sites that emergency physicians have limited opportunities to perform critical pediatric procedures in EDs across the United States. Our results re-emphasize the need for exploring alternative modalities to retain critical skills in children.