Mortality difference between early-identified sepsis and late-identified sepsis
Article information

Abstract
Objective
The aim of the study was to compare the mortality rates of patients with early-identified (EI) sepsis and late-identified (LI) sepsis.
Methods
We performed a retrospective chart review of patients admitted to the emergency department and diagnosed with sepsis. EI sepsis was defined as patients with a Sequential Organ Failure Assessment (SOFA) score ≥2, based on 3 parameters of the SOFA score (Glasgow coma scale, mean arterial pressure, and partial pressure of oxygen/fraction of inspired oxygen ratio), measured within an hour of emergency department admission. The remaining patients were defined as LI sepsis. The primary outcome was in-hospital mortality.
Results
Of the total 204 patients with sepsis, 113 (55.4%) had EI sepsis. Overall mortality rate was 15.7%, and EI sepsis group had significantly higher mortality than LI sepsis (23.0% vs. 6.6%, P=0.003). The patients with EI sepsis, compared to those with LI sepsis, had higher SOFA score (median: 4 vs. 2, P<0.001); Acute Physiology and Chronic Health Evaluation (APACHE) II score (median: 14 vs. 10, P<0.001); were more likely to progress to septic shock within 6 hours after admission (17.7% vs. 1.1%, P<0.001); were more likely to be admitted to the intensive care unit (2.2% vs. 1.1%, P=0.001).
Conclusion
Mortality was significantly higher in the EI sepsis group than in the LI sepsis group.
INTRODUCTION
In 2016, an international task force of the Society of Critical Care Medicine (SCCM) and the European Society of Intensive Care Medicine (ESICM) published new guidelines providing definitions and diagnostic criteria for sepsis (Sepsis-3), using the Sequential Organ Failure Assessment (SOFA) score [1].
Among infectious patients, a SOFA score ≥2 points is considered sufficient for the diagnosis of sepsis, and is associated with an in-hospital mortality of 10%. The SOFA score consists of six items, each representing one organ system: including the respiratory (partial pressure of oxygen/fraction of inspired oxygen ratio, PF ratio), cardiovascular (mean arterial pressure [MAP] and use of ionotropic/vasopressor agents), coagulation (platelet count), liver (bilirubin), kidney (urine output and creatinine), and central nervous (Glasgow Coma Scale, GCS) systems.
When treating patients, some of the tests that are used to determine the SOFA score, such as GCS and MAP, can be done at the bedside. The PF ratio requires arterial blood, but can be determined within a few minutes if point-of-care testing is available. Other tests that require more complex processes, including blood sampling, sample transportation, and laboratory processing, and thus take longer to be determined. Thus, from a physician’s perspective, sepsis can be divided into two categories: early-identified (EI) sepsis which can be determined early using bedside variables, and late-identified (LI) sepsis which is determined after all SOFA items are available.
If the SOFA score had internal validity, subgroups based on criteria unrelated to the severity—time to diagnosis of the sepsis in this case, should have similar mortality. Sepsis is regarded as a medical emergency, because it is associated with a high mortality rate (10%). If mortality rates were shown to be disproportional between patients with EI and LI sepsis, this would raise concerns about the internal validity of the SOFA score. The aim of the study was to compare the mortality rates of patients with EI sepsis and LI sepsis.
METHODS
Study design and setting
The study was based on a retrospective chart review. It was approved by the institutional review board of the Chonbuk National University Hospital (2018-11-001) and was given a waiver of the requirement to obtain informed consent from the patients in the study. The study was performed in a 1,200-bed urban, academic, tertiary-care university hospital. We referred to the Standards for the Reporting of Diagnostic Accuracy (STARD) recommendations when analyzing the results [2,3].
Patient selection
The charts of adult patients (aged 18 years or older) admitted to the emergency department (ED) between November 1, 2016 and December 31, 2016 were screened. The senior emergency medicine resident reviewed the patient’s International Statistical Classification of Diseases and Related Health Problems 10th edition (ICD-10) code at the time of their discharge. This resident was blinded to the study’s objectives and outcomes. Before reviewing the medical charts, the resident was trained to select patients who met a diagnosis of infection according to the ICD-10 classification. To ensure quality control, one of researchers reviewed the data of a randomly-selected 20% sample of the charts of patients that the resident identified as meeting the criteria for inclusion in the review. Based on the Sepsis-3 guidelines, in order to be eligible for inclusion patients were required to have a diagnosis of sepsis based on a SOFA score or an acute change in their SOFA score (if available). Patients diagnosed with sepsis, who did not meet the SOFA score criteria, were excluded. Urine output was not considered in the calculation of the SOFA scores. Patients diagnosed with sepsis prior to admission were also excluded.
Measurements and data collection
Patients with a SOFA score ≥2, based on their GCS, MAP and PF ratio results alone, measured within an hour of admission, are considered to have EI sepsis. Patients with a SOFA score of <2 based on their GCS, MAP, and PF ratio results, and a total SOFA score of ≥2 after their coagulation, liver, and kidney test results have been taken into account are considered to have LI sepsis.
Patients’ data were collected from electronic charts by the senior emergency medicine resident, using a structured form according to the recommendations of Gilbert et al. [4]. The following data were collected: age, sex, emergency medical service use, referral from another hospital or facility, acuity assigned at triage (measured on a scale of 1 to 5, according to the Korean Triage and Acuity Scale); Charlson Comorbidity Index (CCI), (hypertension, diabetes mellitus, malignancy, previous occurrence of cerebrovascular accident, dementia, chronic kidney disease, chronic liver disease, previous myocardial infarction, chronic obstructive pulmonary disease, previous peptic ulcer disease, chronic heart failure, connective tissue disease, hemiplegia, and peripheral vascular disease), source of infection (respiratory, liver-gall bladderpancreas [LGP], genitourinary, gastrointestinal, skin and skeletal, head and neck, vessel or catheter, other source, or unknown source), systolic blood pressure, diastolic blood pressure, pulse rate, respiratory rate, body temperature, PO2, lactate, platelet count, total serum levels of bilirubin, creatinine, ED length of stay, hospital length of stay, quick SOFA (qSOFA) score, SOFA score, Acute Physiology and Chronic Health Evaluation (APACHE) II score, progression to septic shock within 6 hours, admission to the intensive care unit (ICU), admission to a general ward, and inhospital death. The CCI was used to adjust mortality among patient with sepsis.
The laboratory test results needed to determine the SOFA score at the time of admission were also recorded. These results included mental status, partial pressure of oxygen, fraction of inspired oxygen, and use and dosage of inotropic or vasopressor agents. Records of patients’ daily urine output were not available. In patients with pre-existing organ dysfunction, an acute change in the SOFA score made them eligible for inclusion if they met the diagnostic criteria for a diagnosis of sepsis. Diagnoses of sepsis and septic shock were based on the most recent international consensus (Sepsis-3) [1].
Outcome measures
The primary outcome measure was in-hospital mortality. Secondary measures: SOFA score, APACHE II score, septic shock within 6 hours, and ICU admission, were used as indicators of severity.
Statistical analysis
For continuous variables, the means and standard deviations were determined if the data were normally distributed, or the medians and interquartile ranges were determined if the data were not normally distributed. For discrete variables, the frequencies and percentages were determined. As the study was exploratory in nature, we did not perform any sample size calculations.
For missing information, discrete variables were treated as dummy variables and continuous variables were imputed as the mean or median values of each variable. Thus, all subjects were included in the final multivariate analysis.
In order to assess the statistical significance when making comparisons, the Student’s t-test was used for normally-distributed continuous data; the Mann-Whitney U-test was used for continuous data that were not normally distributed; and the Pearson chi-square test was used for categorical data. The Fischer exact test was used instead of the chi square test for 2×2 tables if the number of observations in any of the cells was small. Two-tailed P-values <0.05 were considered to be statistically significant.
The mortality rates associated with the scores for each organ system in the SOFA score in this study were displayed. The mortality rates in the original study were also referenced and displayed [5].
All analyses were performed using R ver. 3.3.1 (R Core Team, Vienna, Austria) or SAS ver. 9.1 (SAS Institute Inc., Cary, NC, USA).
RESULTS
During the study period, 4,791 adult patients visited our hospital ED. After excluding 945 patients with non-medical conditions, and 3,171 patients without infection, 675 patients were identified as potentially eligible. Among these patients, we excluded 321 patients who were not diagnosed with sepsis. Of the 354 remaining patients, 150 patients were excluded because they had been diagnosed with sepsis before admission to the ED. The final sample comprised 204 patients (Fig. 1).

Standards for the Reporting of Diagnostic Accuracy (STARD) flow diagram. ED, emergency department; EI, early-identified; LI, late-identified.
Table 1 shows the characteristics of the enrolled patients. Their median age was 75.0 years (interquartile range [IQR], 84.0-82.0 years), and 119 (58.3%) were males. Hypertension (49.0%) was the most frequent comorbidity, followed by diabetes mellitus (28.9%), malignancy (22.7%), and previous cerebrovascular accident (21.6%). The median CCI was 4 (IQR, 3–5). The respiratory tract was the most frequent source of infection (43.1%), followed by LGP (26.0%), genitourinary (12.8%), and gastrointestinal (9.8%) tracts. The median serum lactate level was 1.4 nmol/L (IQR, 0.9–2.5 nmol/L), and the median SOFA score was 3 (IQR, 2–5). Twenty-one patients (10.3%) developed septic shock within six hours of admission to the ED, and were transferred to the ICU, and 32 patients (15.7%) died during the study period.
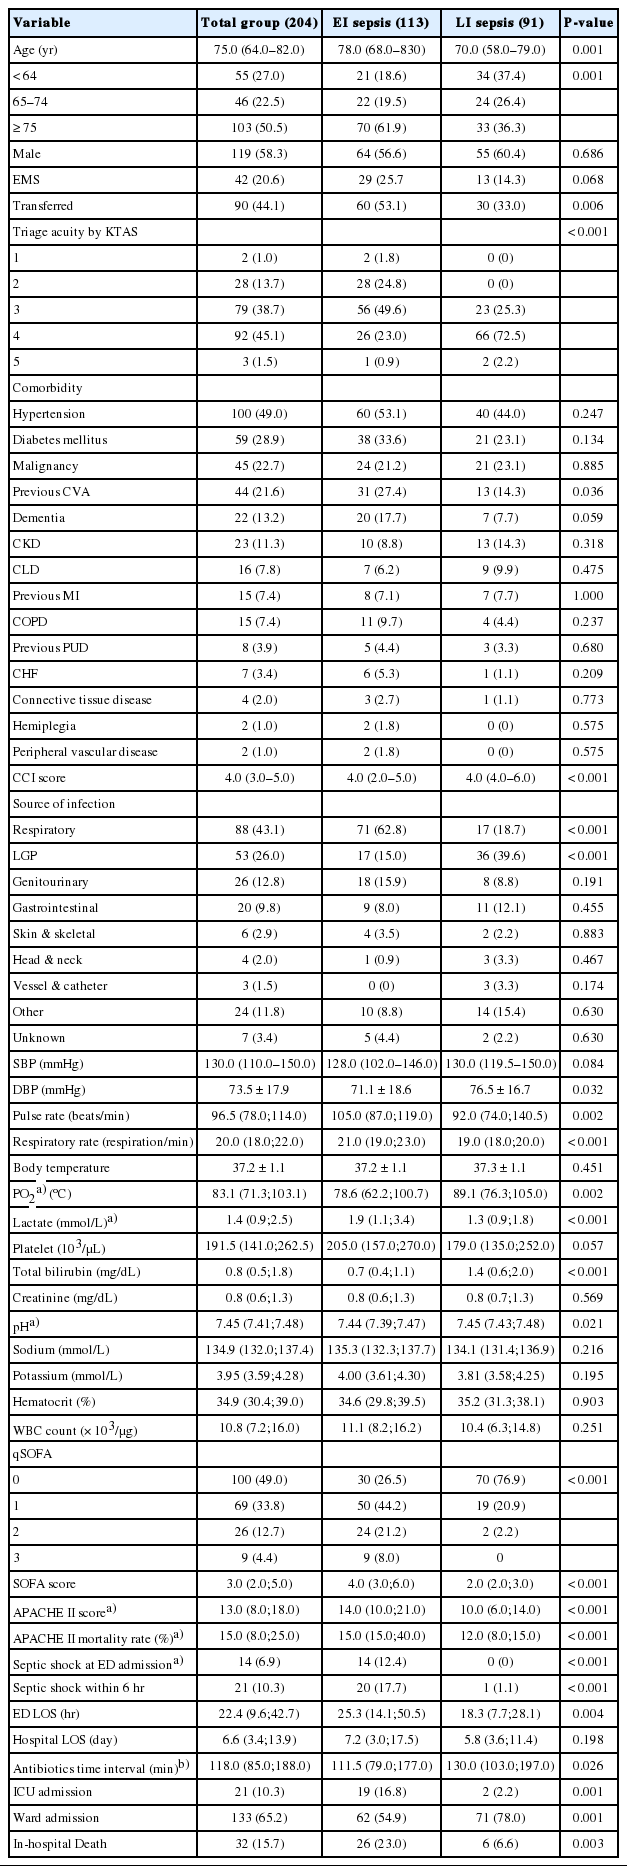
Baseline characteristics of enrolled patients
Of the 204 patients included in the study, 113 were classified as having EI sepsis, and 91 were classified as having LI sepsis. Patients with EI sepsis were older, triaged with higher acuity, and had a higher median CCI. Respiratory tract infection was more frequent in patients with EI sepsis than in those with LI sepsis (39.6% vs. 15.0%, P<0.001), while LGP infection was more frequent in patients with LI sepsis than in patients with EI sepsis (62.8% vs. 18.7%, P<0.001). Patients with EI sepsis had higher lactate levels and lower partial pressures of oxygen and higher platelet counts, while those with LI sepsis had a higher bilirubin level. Patients with EI sepsis had higher qSOFA scores than patients with LI sepsis. The median SOFA score was higher in patients with EI sepsis than in those with LI sepsis (4 [IQR, 3–6] vs. 2 [IQR, 2–3], P<0.001). The median APACHE II score was significantly higher in patients with EI sepsis than in those with LI sepsis (14 [IQR, 10–21] vs. 10 [IQR, 6–14], P<0.001). Compared to patients with LI sepsis, those with EI sepsis had higher rates of progression to septic shock within six hours (17.7% vs. 1.1%, P<0.001), admission to the ICU (16.8% vs. 2.2%, P=0.001), and mortality (23.0% vs. 6.6%, P=0.003) (Fig. 2 and Fig. 3).

Comparison of the in-hospital mortality rate (A), ICU admission rates (B), incidence of septic shock in 6 hours (C) among patients with earlyidentified sepsis (EI sepsis) and late-identified sepsis (LI sepsis).

Median and interquartile range of SOFA score (A) and APACHE II score (B) among patients with early-identified sepsis (EI sepsis) and late-identified sepsis (LI sepsis).
The values of the scores representing each organ system are shown in Table 2. Higher scores were more frequent at central nerve system, cardiovascular, and respiratory scores in patients with EI sepsis, while higher scores were more frequent at liver score in patients with LI sepsis. The time to determine the result of the respiratory score was shorter in patients with EI sepsis than in those with LI sepsis (24 minutes [IQR, 17–32 minutes] vs. 32 minutes [IQR, 22.5–41 minutes], P<0.001). There was no difference between the patients with EI sepsis and those with LI sepsis regarding the median time to determine the results of the coagulation score (67 minutes [IQR, 51–86 minutes] vs. 75 minutes [IQR, 58.5–91 minutes], P=0.079), and liver/kidney score (111 minutes [IQR, 94–157 minutes] vs. 121 minutes [IQR, 95–147.5 minutes], P=0.800).
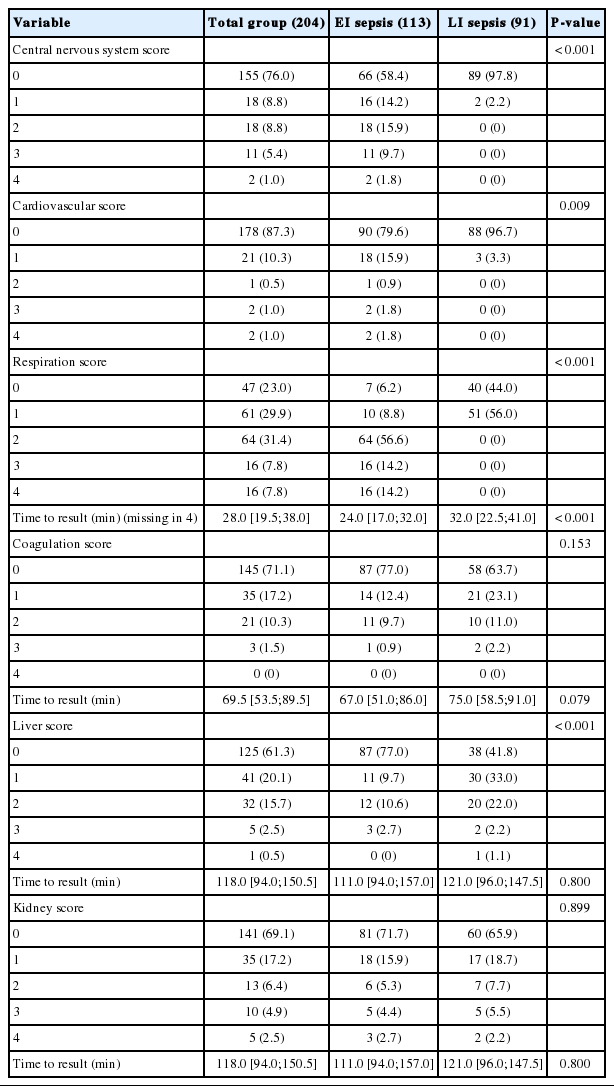
Distribution of the scores in each organ system
The mortality rates associated with the scores for each organ system in the SOFA score, both in the original study and in this study, are shown in Fig. 4. As notable mortality gaps were found in all the scores, (especially the coagulation, hepatic, and renal scores), and the number of deaths was not recorded in the study, we did not make any statistical comparisons between the two studies.

The mortality rates according to the Sequential Organ Failure Assessment (SOFA) sub-scores for each organ system in the original study and in this study. (A) Central nervous system, (B) coagulation, (C) cardiovascular, (D) liver, (E) respiratory, and (F) kidney.
DISCUSSION
This study showed a significant difference in the mortality rates between patients with EI sepsis and those with LI sepsis. This suggests that these two conditions are not equally severe, considering the differences in the SOFA score, the rates of progression to septic shock, and the rates of ICU admission between the two groups. The low mortality rate among patients with LI sepsis raises a concern about the internal validity of the SOFA score system in our cohort. This is in keeping with the latest international consensus that has addressed sepsis as a medical emergency issue, based on the high mortality rates among patients with sepsis [1]. The calculation of the scores representing each organ system in the SOFA score may need adjustment in order to provide better internal validity.
Sepsis is an established term, but the concept and diagnostic criteria for sepsis have been continually reviewed. The American College of Chest Physicians/SCCM consensus conference, held in 1991, defined sepsis as the systemic response to infection, manifest by two or more of the following conditions: (1) body temperature >38°C or <36°C; (2) heart rate >90 beats per minute; (3) respiratory rate >20 breaths per minute or PaCO2 <32 mmHg; and (4) a white blood cell count >12,000/cu mm, <4,000/cu mm, or a proportion of immature (band) forms of >10% [6]. In 2001, a task force, composed of representatives from the SCCM, ESCIM, American College of Chest Physicians, American Thoracic Society, and Surgical Infection Society, defined sepsis as a clinical syndrome characterized by the presence of both infection and a systemic inflammatory response, and specified that the diagnosis of sepsis required the presence of general, inflammatory, hemodynamic, organ dysfunction, and tissue perfusion, variables (a total of 24 variables) [7]. In 2008, the Surviving Sepsis Campaign (SSC) developed a similar definition, that specified that sepsis was an “infection plus systemic manifestations of infection.” [8] In 2015, the SCCM/ESICM consensus (Sepsis-3), developed a definition, that defined sepsis as a life-threatening organ dysfunction caused by a dysregulated host response to infection [1]. This new definition emphasized the primary role of the non-homeostatic host response to infection, the potential mortality, and the need for urgent recognition of sepsis. The task force recommended changing the diagnostic criteria to a baseline SOFA score of ≥2 points in order to characterize organ dysfunction. The task force recommended that the baseline SOFA score should be assumed to be 0, unless the patient was known to have preexisting (acute or chronic) organ dysfunction before the onset of infection [1]. Patients in a general hospital, with presumed infection and a SOFA score ≥2, have an overall mortality of approximately 10% [9].
Originally, the SOFA score, developed by an ESICM consensus in 1994, was designed to quantitatively and objectively describe the degree of organ dysfunction [5]. Those who developed the consensus agreed on three major points: (1) to limit the number of organ systems studied to six, (2) to use a score ranging from 0 (normal) to 4 (most abnormal) for each organ system, and (3) to record the highest values for each organ system on each day.
Further details regarding the process of score assignment to each organ system were not documented in the original study [5]. However, Fig. 4 shows a relatively similar distribution of the mortality rates according to the score assigned to each organ system. Regarding the respiratory tract, the mortality rate was 20% if the score was 0, 26% if the score was 1, 32% if the score was 2, 46% if the score was 3, and 64% if the score was 4. Regarding the CNS, the mortality rate was 26% if the score was 0, 38% if the score was 1, 44% if the score was 2, 58% if the score was 3, and 70% if the score was 4. Regarding the hepatic system the mortality rate was 32% if the score was 0, 34% if the score was 1, 50% if the score was 2, 54% if the score was 3, and 56% if the score was 4. Regarding the renal system, the mortality rate was 25% if the score was 0, 40% if the score was 1, 46% if the score was 2, 58% if the score was 3, and 62% if the score was 4. Regarding the coagulation system, the mortality rate was 36%, if the score was 0 to 2; and 65%, if the score was 3 or 4. Regarding the cardiovascular system, the mortality rate was approximately 24% if the score was 0, 32% if the score was 1, and 56% if the score was 2 to 4 (Fig. 4).
Many studies have validated the SOFA score in a clinical setting [10-12]. After the Third International Conference Definitions for Sepsis and Septic Shock (Sepsis-3) was launched, the SOFA score remained pertinent, and was reported to be a useful predictor on its own, and superior for prognostication than other scores [13-15]. Notably, people responsible for managing patients with sepsis, including physicians, researchers, and policy makers, widely agree that SOFA provides a functional score for the management of sepsis. Nevertheless, the internal validity of the SOFA score should be questioned. Firstly, the previous process to determine the score for each organ system is not well explained. Secondly, the SOFA score was designed more than 20 years ago. Because the treatment of organ dysfunction or failure has significantly improved over the past 20 years, the mortality rate is also likely to have changed. Revisions to the SOFA scoring system may be necessary in order to maintain its internal validity, especially considering that sepsis needs to be treated as a medical emergency due to the high sepsis-related mortality rate. The results of this study are noteworthy because they provide information on the internal validity of the SOFA scoring system.
The classification of sepsis into two categories (EI and LI sepsis) provides a physician-centered perspective. Because half of the clinical variables that are used to calculate the SOFA score cannot be determined immediately, and because of the necessity of early diagnosis and prompt treatment of sepsis, physicians may not feel comfortable with relying on the SOFA score to make decisions regarding patient management [16]. For example, ST segment elevation myocardial infarction is readily diagnosed by electrocardiography, and the need for a prompt treatment can be determined rapidly without assessing the patient’s SOFA score. In contrast to this, some infected patients may not have early signs and symptoms of sepsis, making it difficult to make prompt decisions regarding the initiation of appropriate treatment. Of note, qSOFA seems to be insufficient in this cohort, considering that 17.1% of the patients in the study had qSOFA scores ≥2 (29.2% in those with EI sepsis and 2.2% in those with LI sepsis). Furthermore, the SSC recommends the implementation of the SSC Hour1 Bundle, a set of decision points to be taken within the first hour of sepsis recognition. The bundle comprises the measurement of serum lactate levels, blood culture, administration of broad-spectrum antibiotics, administration of crystalloid for hypotension or hyperlactatemia, followed by the administration of vasopressors [16]. However, this study shows that the SSC Hour-1 Bundle has limitations because it took approximately two hours to diagnose LI sepsis.
Sepsis severity was found to be lower in patients with LI sepsis, as shown by the lower rates of mortality, septic shock and ICU admission, as well as the lower median SOFA score in this group. This can help minimize the stress among physicians regarding the need for early diagnosis and treatment for LI sepsis. On the other hand, concerns may be raised about the internal validity of the SOFA score. In order to achieve internal validity, it may be necessary to adjust the SOFA scores for each organ system. As shown in Fig. 4, notable differences in mortality according to each score were found when the original study was compared to this study, especially a temporal decrease in the mortality rates associated with the scores representing the hepatic and renal systems. The decrease in mortality rates over time may be due to improved radiologic and endoscopic interventions, such as percutaneous transhepatic biliary drainage, percutaneous transhepatic gallbladder drainage, and endoscopic retrograde biliary drainage [17-19]. Other factors, such as the introduction of technologies for continuous renal replacement therapy [20,21] and early goal directed therapy for treatment of severe sepsis [22] may also play a role. In this study, there were no deaths among the patients with the highest SOFA scores of the CNS, coagulation system, and hepatic system. This may be attributable to the small number of patients in these categories.
The main limitations of this study was its retrospective design, using a simple chart review as the source of data, and carrying out the study at only one facility. These limitations limit the inferences that can be drawn from the study results. A multicenter study is required to better evaluate these data. However, our results confirm that mortality rates differ significantly among patients with EI sepsis and LI sepsis, and that the internal validity of the SOFA score needs to be reevaluated. Most of the data required for the analysis were easy to obtain, and can be considered to be reliable. Secondly, the approximate difference of two hours in the time taken to diagnose EI sepsis and LI sepsis is longer than that which occurs in some clinical settings, thus limiting the generalizability of our findings. For example, serum platelet count, and serum bilirubin and creatinine levels, can be rapidly determined using commercial point-of-care testing devices [23-25]. This, narrows the division of EI sepsis and LI sepsis and thus makes the distinction between EI sepsis and LI sepsis less useful from a physician perspective. Nevertheless, the disproportionately high mortality rate in patients with EI sepsis compared to those with LI sepsis is still noteworthy. Thirdly, alternative criteria such a relying on single components of the SOFA score (e.g., the cardiovascular system or respiratory system sub-scores) could be useful in dividing patients with sepsis into these two subgroups for the purpose of clinical management. However, a disadvantage of using subscores is that it could lead to the development of many fragmented criteria. Therefore, we chose to study sepsis from a physician-centered perspective, in order to facilitate physicians’ bedside decision-making regarding treatment.
In conclusion, the mortality rates were significantly higher among patients with EI sepsis than in those with LI sepsis. Considering that the results of tests performed at the bedside had a greater prognostic value than tests with a longer turn-around time, we recommend that the SOFA scoring system be revised.
Notes
No potential conflict of interest relevant to this article was reported.
References
Article information Continued
Notes
Capsule Summary
What is already known
For infectious patients, a Sequential Organ Failure Assessment (SOFA) score ≥2 points is currently enough to diagnose sepsis, with in-hospital mortality of 10%, which is regarded as a medical emergency. Because some parts of a SOFA score are able to be determined early, but some are not, early identified sepsis and late identified sepsis can present to emergency department physicians.
What is new in the current study
A significant mortality difference was noted between early identified sepsis and late identified sepsis. The contribution of the variables of the SOFA score to mortality seemed not to be uniform, raising the question about the internal validity of a SOFA.