In-hospital mortality in the emergency department: clinical and etiological differences between early and late deaths among patients awaiting admission
Article information

Abstract
Objective
Given that there are no studies on diseases that occur by waiting for hospitalization, we aimed to evaluate the main causes of death in the emergency room (ER) and their relationship with overcrowding.
Methods
Patients who died in the ER in the past 2 years (pediatrics and trauma victims excluded) were divided into two groups: patients who died within 6 hours of arrival (emergency department [ED] group) and patients who died later (LD group). We compared the causes of death, total vital signs, diagnostic tests performed, and therapy between the groups. We assessed for possible correlation between the number of monthly deaths per group and four variables of overcrowding: number of patients treated per month, waiting time before medical visit (W-Time), mean intervention time (I-Time), and number of patients admitted to the ward per month (NPA).
Results
During the two years, 175 patients had died in our ER (52% in ED group and 48% in LD group). The total time spent in the ER was, respectively, 2.9±0.2 hours for ED group and 17.9± 1.5 hours for LD group. The more frequent cause of death was cardiovascular syndrome (30%) in ED group and sepsis (27%) and acute respiratory failure (27%) in LD group. Positive correlations between number of monthly deaths and W-Time (R2 0.51, P<0.001), I-Time (R2 0.73, P< 0.0001), and NPA (R2 0.37, P<0.01) were found only in LD group.
Conclusion
Patients with sepsis and acute respiratory failure die after a long stay in the ER, and the risk increases with overcrowding. A fast-track pathway should be considered for hospital admission of critical patients.
INTRODUCTION
Deaths in the emergency department (ED) have been extensively studied during the past two decades, in an attempt to fathom the role of precipitating factors in such peculiar context [1]. The ED acts as a crucial interface between the catchment area and hospital facilities. The emergency care system gains benefit from the continuous analysis of epidemiological indicators: this allows effective process management, correct use of resources, and rational application of algorithms to reduce the impact of global issues such as overcrowding [2]. Data reported in previous studies have revealed that the incidence of early death in the context of ED care is 5 to 30 deaths per 100,000 visits. A thorough and systematic review of death records can help characterize unanticipated deaths during ED care; further research is needed to identify and thus prevent complications and reduce the rate of deaths during ED visit [3].
The ED boarding time increases the mortality rate and leads to a longer hospital stay [4]. The increased risk of mortality in patients who wait for a long time to admit is mainly related to overcrowding [5] and difficulty in guaranteeing adequate care because staff members are often engaged in stabilizing new patients who arrive at the ED or have difficulties in ensuring adequate monitoring and correct timing [6,7].
According to recent data, a remarkable proportion of deaths—especially those occurring within a 2-hour timeframe from ED arrival to admission—can be attributed to cardiovascular disease [1]. In such cases, patients often do not undergo the appropriate diagnosis: these deaths are generically referred to as cardiovascular events, without autopsy confirmation [8]. Singer et al. [4] identified the first 6-hour ED stay as a critical factor; after the first 6 hours of ED stay, the risks of mortality and admission to the intensive care unit increased by twofold progressively when patient permanence exceeded 24 hours. Chalfin et al. [9] reported a higher in-hospital mortality rate (17.4% vs. 12.9%) in a cohort of 120 hospitals for patients who were in the ED for more than 6 hours. Because of overcrowding, the risk of medical error becomes even more tangible, especially when we consider patients staying for long periods in overcrowded ED hallways/observation rooms [10]. The economic burden for patients is particularly high for those who are affected by diseases and needing critical care—such as patients with respiratory insufficiency who need noninvasive ventilation [11] or sepsis subjects—who usually stay in the ED for a long time before being assigned to the appropriate hospital ward [12,13].
Currently, there is a lack of studies on the occurrence of diseases by waiting for hospitalization. Our study, therefore, aimed to analyze the characteristics and causes of death in patients who died immediately after ED admission (<6 hours) and in patients who died during the hospital stay (≥6 hours), waiting for admission in a specific ward.
METHODS
Ethics statement
Data were collected in accordance with the Declaration of Helsinki. This is an observational and retrospective study that did not involve any intervention on patients. All patients provided their consent for using the data anonymously, at the time of access to emergency care. The study was conducted with the approval of the committee for review and approval of the research project of San Giovanni Addolorata (prot. 0118467/2017).
Population and study design
In this retrospective study, we collected the data of patients who died in the emergency room (ER) of our tertiary referral center hospital between January 1, 2017, and December 31, 2018, and recorded the information on an Excel spreadsheet. All patients aged <18 years and who were already dead at the time of arrival to the ER were excluded. All trauma victims, people who died in the first hour or who arrived already with resuscitation maneuvers ongoing at the entrance (to exclude subjects for whom it was difficult to understand the cause of death) were excluded from the study analysis. The cause of death was certified by the pathologist in 64% of cases. In cases where an autopsy was not performed, the final cause of death was the pathology, as reported in the death certificates drawn up by doctors. Ambiguous or undetermined diagnoses such as “cardiac arrest” or “respiratory arrest” were not considered. Patients for whom there were more possible or equally possible causes of death were also excluded from the analysis.
Patient clinical assessment
We recorded the data of the following variables for every patient: age, sex, time of intervention in the ER, main admittance symptom, triage code color, systolic and diastolic blood pressure, heart rate, respiratory rate (RR), core temperature (CT), Glasgow Coma Scale, peripheral oxygen saturation (SpO2), past medical history, treatment administered, blood tests (white blood cell count; platelet count; and hemoglobin, creatinine, electrolyte, high-sensitivity troponin I levels). To standardize patients in terms of severity, the modified early warning score (MEWS) was calculated for every patient at the entrance [14]. The main causes of death were also recorded and divided into six groups: acute respiratory failure (ARF), acute neurological syndrome (ANS), acute cardiac syndrome (ACS), septic shock (SS), hemorrhagic shock (HS), and other causes (i.e., pulmonary embolism, renal failure, metabolic acidosis, other causes of shock or causes that cannot be determinable).
Evaluation of the ED overcrowding
To evaluate the effect of overcrowding, along with the general data of patients, we analyzed the number of deaths in each month, and we compared the value with the average overcrowding indices for the same months. According to the Asplin model [13,15], we recorded and analyzed the number of patients treated at the ER in the same period (NPT) as an input variable; the average waiting time for the doctor’s evaluation (W-Time) and the mean intervention time (I-Time) for each patient as throughput variables; and the number of patients admitted to the hospital (NPA) as an output variable.
Statistical analysis
The patients were divided into two groups: ED group (also known as “early death,” i.e., death within 6 hours from ED arrival to admission) and LD group (also known as “late death,” i.e., death after 6 hours from ED arrival to admission). We compared all the variables and characteristics between the groups. The 6-hour threshold was chosen because it coincides with the ideal maximal time of stay in the ER before admission [4,7]. After 6 hours of boarding in the ER, the in-hospital mortality risk begins to increase [4,9].
Statistically significant differences were determined at a threshold of 95% (P<0.05). All statistical examinations were performed using StatPlus Pro ver. 7 (AlaystSoft Inc., Walnut, CA, USA). Data of continuous variables are shown as mean±standard error (except for age, which is expressed as mean±standard deviation) and median and interquartile range (IQR). Normality and uniformity in the distributions of variables were assessed using the Shapiro-Wilk and Kolmogorov-Smirnov tests. The differences between mean values were assessed using the t-test when two groups were compared, whereas the one-way analysis of variance with post-hoc Bonferroni correction was utilized to identify the statistically significant differences within two groups, when the normality and uniformity of the variables were confirmed. Differences between median values were verified using the Mann-Whitney test. Categorical variables were summarized in crosstab, expressed as % of the group, and analyzed using the chi-square test, and if the test yielded a significant result, then it was further analyzed with a z-test. Correlations between overcrowding data and number of deaths were analyzed using the Pearson regression test and verified with a univariate linear regression analysis. The coefficient of the linear regression analysis was estimated by the method of minimal squares, and the strength of the correlation was expressed as the correlation coefficient (R2).
RESULTS
Between January 1, 2017, and December 31, 2018, 175 patients died in the ER and their data satisfied the inclusion criteria of the study. The more frequent causes of death were ACS (19% of total), SS (22%), ARF (18%), ANS (16%), and HS (10%). Other causes (15% of total) included dialysis, hematological syndromes, and unknown cause of death.
The ED group included 90 patients (52%), whereas the LD group included 85 patients (48%). The more frequent cause of death in the ED group was ACS (30% of ED group), followed by SS (18%) and HS (16%). In the LD group, the more frequent causes of death were SS (27% of LD group), ARF (27%), and ANS (15%). Fig. 1 summarizes the frequency of deaths in each group, expressed as % of the total deaths for each cause (χ2 28.8, dF 5, P<0.001). As shown in Fig. 1, for ACS and HS, the deaths occurred mainly in the first 6 hours, while for ARF and SS, the converse was observed.
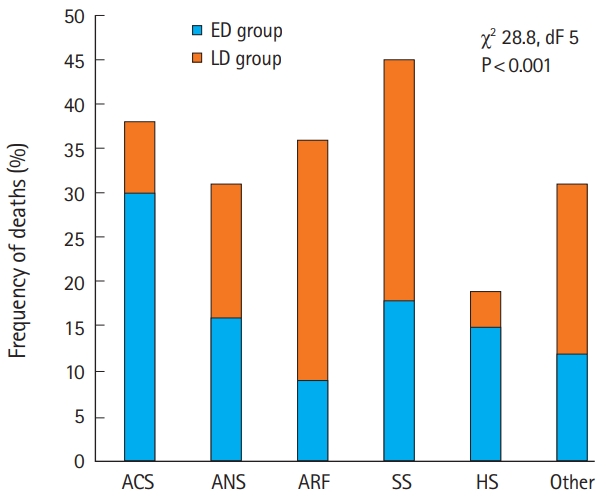
Frequency of deaths in each syndromic group expressed as % of total death. Patients who died within 6 hours of arrival (ED group) and patients who died later (LD group) are represented, respectively, as blue and orange columns. ACS, acute cardiac syndrome; ANS, acute neurological syndrome; ARF, acute respiratory failure; SS, septic shock; HS, hemorrhagic shock.
The mean time in the ER was 2.9±0.15 hours for the ED group and 17.9±1.5 hours for the LD group. As shown in Fig. 2, patients affected by ANS, ARF, and SS were the ones who stayed for more time in the ER (13.2±3.4, 12.9±2.0, and 11.9±1.5 hours, respectively; one-way analysis of variance: F 3.3, P<0.01).
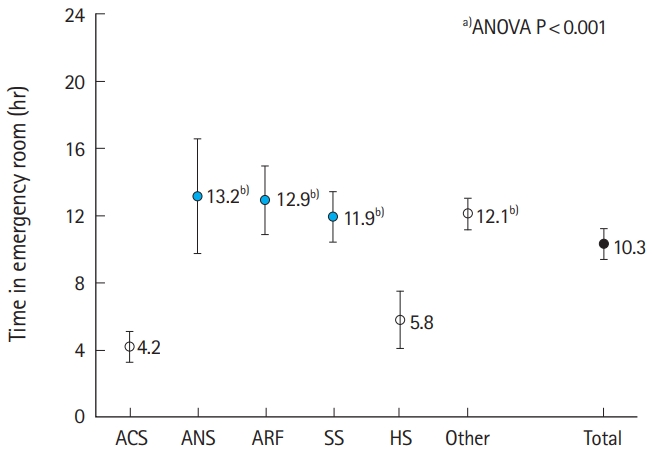
Time in emergency room (ER) in each syndromic group. Data are presented as mean±standard error. ACS, acute cardiac syndrome; ANS, acute neurological syndrome; ARF, acute respiratory failure; SS, septic shock; HS, hemorrhagic shock. a)One-way ANOVA between groups P<0.05. b)P<0.01 vs. ACS.
At arrival to the ER, the ED group showed significantly lower values of RR, SpO2, and CT than the LD group (Table 1). High-sensitivity troponin I levels were higher in the ED group than in the LD group, but the difference was not significant because of the great variability in the absolute values among patients (529±257 vs. 87±21 mg/L; t-test 1.7, P=0.09). The MEWS score was not significantly different between the two groups (ED group vs. LD group: 5.7±0.3 vs. 5.2±0.2; t-test 1.5, P=0.10) and within the different syndromes (mean values: ARF 5.6±0.3, ANS 4.9±0.5, ACS 5.4±0.5, SS 6.4±0.4, HS 4.4±0.6, others 4.9±0.4; F 2.3, P=0.05).

Characteristics of patients in each group
The therapy administered in the ER was also considered (Table 2). There was a higher use of vasoactive amines (ED group vs. LD group: 50% vs. 31%, P<0.05) and a higher need for cardiopulmonary resuscitation procedures (ED group vs. LD group: 76% vs. 65%, P<0.05) in the ED group than in the LD group, whereas in the LD group, the use of corticosteroids (17% vs. 50%, P<0.01) and antibiotics (13% vs. 58%, P<0.01) was more frequent.

Therapy administered during emergency room stay and proportion of patients treated in each group
In our study, six patients who were affected by SS did not receive any antibiotic in the ER: two patients had received antibiotic therapy before entering the ER and four patients did not receive any antibiotic therapy at all (neither in the ER nor at home). The mean time of stay in the ER was 3.17 hours (minimum 2.26 hours, maximum 4.16 hours), a time span that justifies the failure to administer the drug.
Respiratory support was required in 77% of the cases: oral tracheal intubation (OTI, 12%), non-invasive ventilation (NIV, 21%), and oxygen supplementation (O2-Sup, 44%). In the ED group, 58% of the patients were assisted only by O2-Sup and 21.1% of the patients received OTI, which was the main modality for ventilator support. In the LD group, 29% of the patients were supported by O2-Sup and 4% received OTI, and the more frequent system to support ventilation was NIV, which was administered to 37% of the subjects (χ2 44.1, dF 3, P<0.001).
We analyzed the trends in deaths during the study period and found that while the deaths from the ED group were almost stable from month to month, LD group deaths were more pronounced in the winter months (Fig. 3). Crossing the trends of deaths within the study period with NPT, W-Time, I-Time, and NPA, we found a significant direct correlation between LD group monthly deaths and W-Time (R2 0.51, P<0.001), I-Time (R2 0.73, P<0.001) (Fig. 4), and NPA (R2 0.35, P<0.05); no correlations were found between LD group monthly deaths and NPT (R2 0.05, P-value not significant). The application of the same statistical methodology showed non-significant results in the ED group (monthly ED group deaths vs. NPT, R2 0.002; vs. W-Time, R2 0.03; vs. I-Time, R2 0.001; vs. NPA, R2 0.01; P-value not significant).
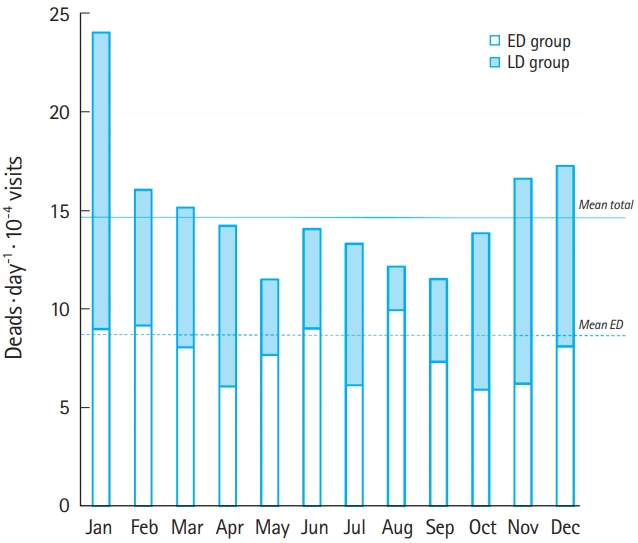
Trends in the number of deaths in the two groups: patients who died within 6 hours of arrival (ED group) and patients who died later (LD group) at various months. The values are normalized for the number of visits per day.

Relationship between monthly average waiting time (W-Time) (A,B) and intervention time (I-Time) (C,D) expressed in minutes and the number of deaths per month. There was a significant correlation between the average W-Time and I-Time and the number of deaths that occurred in the month in the LD group (A,C) but not in the ED group (B,D). ED group, patients who died within 6 hours of arrival; LD group, patients who died later.
DISCUSSION
Studies on “ER overcrowding and death rates” have shown that overcrowding of an ED can lead to a decrease in the health care quality provided and an increase in the number of deaths [15]. Most studies have focused on a wider picture, describing the problem in general terms and proposing possible or feasible solutions [2]. Our study aimed to analyze the causes of death in the ER to determine which medical conditions were affected by overcrowding.
First, we found a relevant epidemiological difference between ED group and LD group. The ED group is represented mostly by cardiac conditions (30%). When analyzing the proportion of deaths that occurred in the first 6 hours for each syndrome, ACS and HS were the conditions in which deaths occurred mainly in the first hours of treatment (79% in ED group for ACS and 82% in ED group for HS, c2 P<0.001), whereas in ARD and SS, deaths occurred mainly after 6 hours of treatment in the ED (74% in LD group for ARD and 59% in LD group for SS, c2 P<0.001). Both ACS and HS are conditions that usually have an established “clinical and treatment path” that allows patients presenting with these syndromes to be rapidly admitted to a department where specialist care is immediately available. The perfect example of this could be any patient presenting with an acute coronary disease, wherein as soon as the diagnosis is made (in our hospital, where the ESC [European Society of Cardiology] 0–3 hour protocol for high-sensitivity troponin I is applied, usually within 3 hours and sometimes even before the diagnosis when the suspicion is high), the patient is sent immediately to the coronary intensive care department for accurate treatment [16]. The LD group, instead, consisting mostly of cases of SS and ARF, showed a very long mean time of boarding in the ER (SS 11.9±1.5 hours and ARF 12.9±2.0 hours). In the ED, which is designed and built to address acute problems in the first hours of presentation, a boarding of more than 12 hours could mean that too few resources are available, and therefore, the ED cannot be committed to manage such patients.
The management of these patients in the ER could be possible, but considering the quantity and quality of resources needed in terms of manpower and consumables, it could affect the resources required for the rest of the ER. Indeed, as shown in our data, during periods of the ER overcrowding, the death rates of the LD group are affected at a higher rate and increase with significant correlation with the variables of throughput and output, and not with the number of patients who came to the ER (Fig. 4).
Considering the “Asplin model” of the ER crowding [13,15], the logical solution to this issue is to work on the throughput and output phases of patient management. In the throughput phase, a faster diagnostic pathway applicable to the most critical patient should be created, particularly for sepsis patients. Clinical scores such as qSOFA or MEWS [17], blood test investigations including procalcitonin, and measurement of clinical parameters should be systematically applied to accurately identify the most critical patients. In the output phase, these patients should be quickly admitted to departments with the necessary resources to manage their conditions. Sending a sepsis patient to a general internal medicine ward would not be appropriate in some instances; moreover, the use of beds in subintensive and intensive care departments seems more advisable and appropriate. The same considerations could be applied for respiratory insufficiency patients, who often experience prolonged ED stay, especially those treated with NIV [11].
The study highlights how overcrowding creates negative effects on clinical syndromes (i.e., sepsis and respiratory failure) that require intensive monitoring. However, some important limitations should be considered. Importantly, because of the retrospective design of the study, we could not determine whether rapid hospital admission would improve the prognosis of these patients. Nevertheless, the strong correlation between the number of deaths and all the main variables of the throughput and output phases requires reconsideration of the clinical pathways of these patients. It is well demonstrated that the first hours of treatment in these critical patients are determinants for the subsequent clinical course of respiratory failure [18,19] and sepsis [20] patients. In our observation, the mean time spent in ER in the LD group was 17.9±1.5 hours, far beyond the recommended time for hospitalization. Certainly, studies investigating the effect of rapid access to suitable wards of these patients would be desirable. The origin of data from a single center would be another possible limitation. Although this is a pilot study, given the importance of the results, it would be useful to perform a multicenter study involving settings with different care capacities. However, it should be emphasized that respiratory failure and sepsis, although considered as pathologies that require urgent treatment, are not among the “time-dependent” syndromes for which there is a defined clinical pathway that quickly aids hospitalization in an appropriate ward (as is the case for heart disease or stroke).
In conclusion, rapid admission to a specialized clinical setting, even if within the same department but far from the ER, would be desirable for critical patients [18]. Our analysis might highlight the need for a better definition of categories of patients who could benefit from ad hoc algorithms, aimed at rapid admission to appropriate specific wards. A longer and larger prospective study might be useful to establish the real impact of patient conditions requiring treatment in the ER on outcomes.
Notes
No potential conflict of interest relevant to this article was reported.
Acknowledgements
A special thanks to Simona Dionisi, Caterina Pandolfi, Gianluca Borgonuovo, and Anna Romito which support the authors in data collection, clinical support, and data interpretation before and during the writing of the manuscript.
References
Article information Continued
Notes
Capsule Summary
What is already known
Data reported in previous studies have revealed that the incidence of death in the context of emergency department care is greatly influenced by boarding and overcrowding. Despite the fact that deaths in the emergency department have been extensively studied during the past two decades, there is a lack of data on which categories of patients may be most affected by overcrowding in the emergency room.
What is new in the current study
We intended to highlight which syndromes were most affected by overcrowding and for which re-evaluation of the clinical path was necessary. We found that deaths that occur immediately after arriving at the emergency room and those that occur while waiting for hospitalization have different etiologies. The second group mainly consists of patients with sepsis or respiratory failure, and the number of these deaths depends on overcrowding. The findings of this study could help health care planners in revising the way the resources and structural space are allocated to different departments in a hospital and improve the outcome of these patients.