Characteristics of frequent emergency department users in Korea: a 4-year retrospective analysis using Korea Health Panel Study data
Article information

Abstract
Objective
We aimed to investigate the characteristics of frequent emergency department (ED) users in Korea.
Methods
We analyzed the Korea Health Panel Study data of a sampled population from the 2005 Population Census of Korea data, and adults (age ≥18 years) who visited the ED at least once a year between 2014 and 2017 were included in the study. People who visited three or more times a year were classified as frequent users. We compared demographic, socioeconomic, and health-related factors between nonfrequent and frequent users. We used a multivariable logistic regression analysis to determine factors related to frequent ED visits. We also compared the characteristics of ED use in both nonfrequent and frequent users.
Results
A total of 5,090 panels were included, comprising 6,853 visits. Frequent users were 333 (6.5% of all panels), and their ED visits were 1,364 (19.9% of all ED visits). In the multivariable regression analysis, medical aid coverage (adjusted odds ratio [aOR] of the National Health Service coverage, 0.55; 95% confidence interval [CI], 0.40–0.75), unemployment (aOR of employment, 0.72; 95% CI, 0.56–0.91), prior ward admission in a year (aOR, 2.14; 95% CI, 1.67–2.75), and frequent outpatient department use (aOR, 1.72; 95% CI, 1.35–2.20) were associated with frequent use. Moreover, frequent users visited the ED of public hospitals more often than than nonfrequent users (19.2% vs. 9.8%). Medical problems rather than injury/poisoning were the more common reasons for visiting the ED (84.5% vs. 71.2%).
Conclusion
We found that frequent ED users were likely to be those with socioeconomic disadvantage or with high demand for medical service. Based on this study, further studies on interventions to reduce frequent ED use are required for better ED services.
INTRODUCTION
Emergency department (ED) overcrowding is a challenging issue because it is closely related to decreased quality of care, safety concerns, reduced patient satisfaction, and increasing medical costs [1-3]. The volume of ED attendance has increased in many developed countries, ranging from 3% to 6% annually [4]. Frequent ED users were defined as people who visit ED multiple times in a year in previous studies, and they may be a factor contributing to the increasing volume of ED attendance. Because the threshold of multiple ED use was different among the studies (range of 2 to 10 times in a year) [5], statistics about frequent ED users differed in previous studies. In Korea, 3.1% of ED visitors were denoted as frequent ED users (ED attendance more than four times a year), accounting for 14% of all ED visits in 2009 [6]. A previous systematic review revealed that frequent ED users accounted for only 4.5% to 8% of all ED patients, but corresponded to 21% to 28% of all ED visits [5].
Thus, it is important to investigate the characteristics of frequent ED users to serve as baseline data for future studies or to underpin policy for decreasing ED “input.” Most previous studies on this issue were hospital-based; thus, they have limited generalizability. Moreover, there are only a few reports on this issue in Korea. Although a single population-based study evaluated the characteristics of frequent ED visits in Korea, the study utilized insurance claim data only, and the number of variables was insufficient to explain the association with frequent ED visits [6]. In our study, we investigated demographic, socioeconomic, and personal health-related factors and we evaluated the association of these factors with frequent ED visits using population-based data from a nationwide medical panel survey.
METHODS
Study design
This retrospective observational study was conducted after approval by the ethics committee of Inje University Ilsan Paik Hospital (No. 2021-08-010). We analyzed fully anonymized data of the Korea Health Panel Study (KHPS) version 1.6 for a 4-year period (2014–2017). Informed consent was waived because of the retrospective nature of the study.
The KHPS data has been collected by the Korea Institute for Health and Social Affairs and the National Health Insurance Service since 2008 and is an official statistical investigation. The KHPS gathered baseline data about medical service and expenditures, and insurance coverage for health care and health insurance policies. The sampling frame was 90% of the national population in the 2005 Population Census of Korea, and a two-stage probability proportionate, and stratified cluster sampling method was adopted. In the first step, the population was stratified in accordance with geographic area using household registries (16 metropolitan cities and provinces, and two towns), yielding 237,165 clusters. Next, a total of 350 sample clusters were extracted from the whole population cluster, and then sample households were extracted from the sample clusters. Finally, family members from the sample households were denoted as Korean health panels. At inception, approximately 8,000 households across the nation were sampled. The survey was conducted by trained investigators once a year based on self-reporting questionnaires and in-person interviews. Receipts for medical expenses and prescriptions were used as supporting evidence for the use of medical services.
Subjects
We included adults (age ≥18 years) who visited the ED at least once in a calendar year between 2014 and 2017. A panel in each year was considered an independent case if a panel met the inclusion criteria for multiple years. We operationally defined three or more visits in a year as the threshold of “frequent ED visits” used in the previous study [7].
Data collection and statistical analysis
First, demographic data were collected for each patient including sex, age, marital status, education, national health insurance service type, employment, household income, region of residence, presence of disability, presence of chronic illness, medication use for chronic conditions, household income, frequency of annual ED visits and outpatient department (OPD) visits (visits within a calendar year), and prior hospital ward admission within a calendar year. Next, we gathered information about ED service: transport method to the ED, reason for the visit, day of visit (weekday or weekend), medical services provided, primary diagnosis, discharge after ED treatment, and the ownership and grade of hospital.
The variables were categorized as follows: patients were grouped into four age ranges (18–34, 35–49, 50–64, and ≥65 years), and the region of residence was divided into three groups (capital, metropolitan city, and province). Income was classified into quintiles (fifth quintile designated as the highest household income). The average number of OPD visits of included panels was 19, thus we defined panels who visited the OPD 19 or more times in a year as frequent OPD visitors. When a panel visited the ED three times or more in a year, they were categorized as frequent ED users. The transport method was categorized as public ambulance, private ambulance, or self. Hospitals were categorized into three groups (tertiary hospital, general hospital, and hospital/clinic); hospital ownership was categorized as private or public. Case dispositions were classified as admission (admitted or transferred to another hospital) or discharged home.
The panels were divided into two groups according to the frequency of ED visits: nonfrequent ED visits and frequent ED visits. The frequency and percentage of the following panel’s personal characteristics were calculated, and the differences between groups were evaluated using the chi-square test or Fisher exact test; sex, age group, marital status, education, household income, region of residence, insurance type, employment, disability, presence of chronic disease, prior ward admission within a calendar year, frequent OPD user and medication use for chronic conditions. Multiple logistic regression analysis was performed to determine factors associated with frequent ED visits (three or more in a year). Finally, we compared the following factors related to ED services between the two groups using the chi-square test or Fisher exact test; hospital ownership, hospital grade, transport method, reason for visit, day of visit, medical services provided, ED discharge, ED satisfaction, and primary diagnosis. For this analysis, each ED visit was considered an independent visit. We conducted statistical analysis using IBM SPSS ver. 21 (IBM Corp., Armonk, NY, USA), and a P-value <0.05 was considered to be statistically significant.
RESULTS
A total of 5,090 panels accounting for a total of 6,853 ED visits were noted in the study period. There were 333 frequent users (6.5% of all panels), accounting for 1,364 ED visits (19.9% of all ED visits).
The characteristics of nonfrequent and frequent ED users
The older age group (age ≥65 years) showed a higher proportion of frequent users (54.1% vs. 38.2%) (Table 1). Patients with a low level of education (under high school graduates), patients with a low household income (first and second quintiles) and those that were unemployed were more frequent users (79.3% vs. 70.3%, 50.1% vs. 41.4%, and 61.3% vs. 48.0%). Patients with medical aid coverage accounted for more frequent users (18.0% vs. 8.1%). A high proportion of frequent ED users was made up of patients with relatively high medical use (prior ward admission, frequent use of OPD, and the presence of chronic disease).
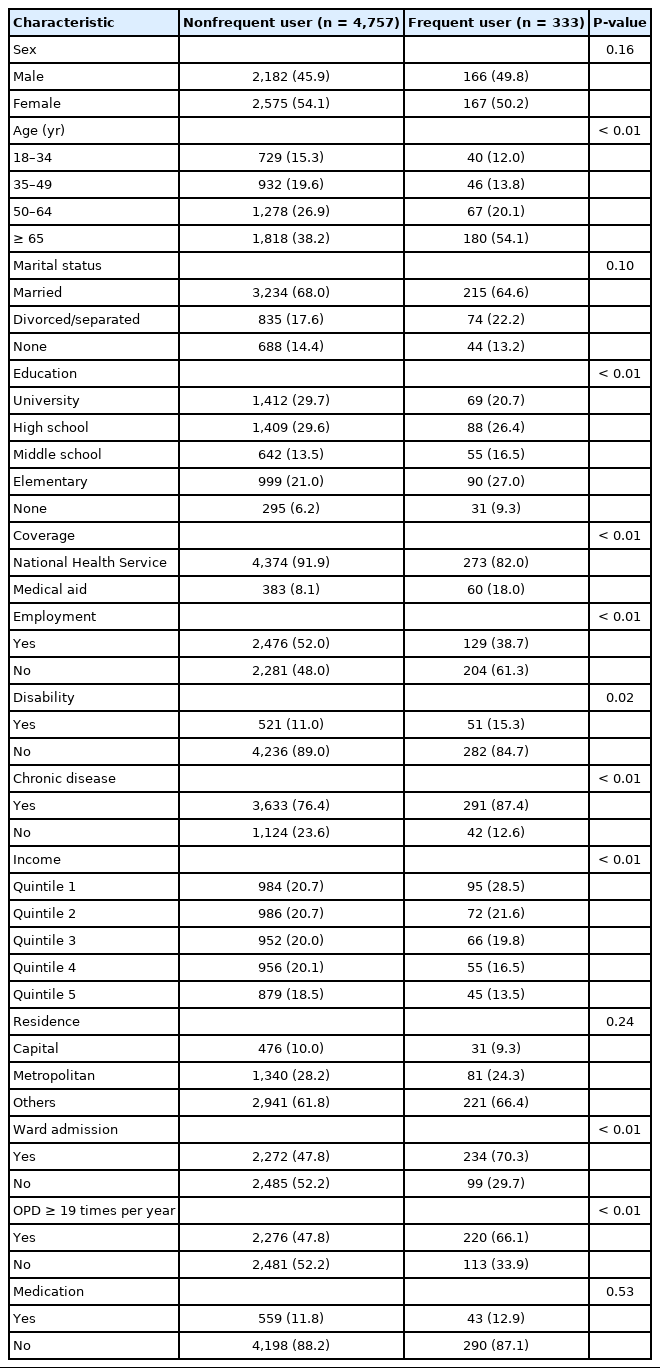
Demographics and socioeconomic characteristics of frequent and nonfrequent emergency department users
A regression analysis of patients’ characteristics with frequent ED use
NHS coverage and employment showed a lower association with frequent ED use; odds ratio (95% confidence interval) of 0.55 (0.40-0.75) and 0.72 (0.56-0.91), respectively (Table 2). Conversely, ward admission and frequent use of the OPD were greatly associated with frequent ED use; odds ratio (95% confidence interval) of 2.14 (1.67-2.75) and 1.72 (1.35-2.20), respectively.

Logistic regression analysis including demographic and socioeconomic factors associated with frequent emergency department visits
The characteristics of ED services of nonfrequent users and frequent users
Frequent users visited public hospital EDs more often than private hospital EDs (19.2% vs. 9.8%) (Table 3). The proportion of ED visitors with medical problems was higher in the frequent user group than in the nonfrequent user group (84.5% vs. 71.2%). The proportion of surgical treatment was higher in the nonfrequent user group (4.4% vs. 1.5%). Among medical diagnoses, the proportion of cardiologic, pulmonary, and hematologic/oncologic diagnoses was higher in the frequent user group (10.9% vs. 7.4%, 13.9% vs. 11.3%, and 10.5% vs. 3.0%).
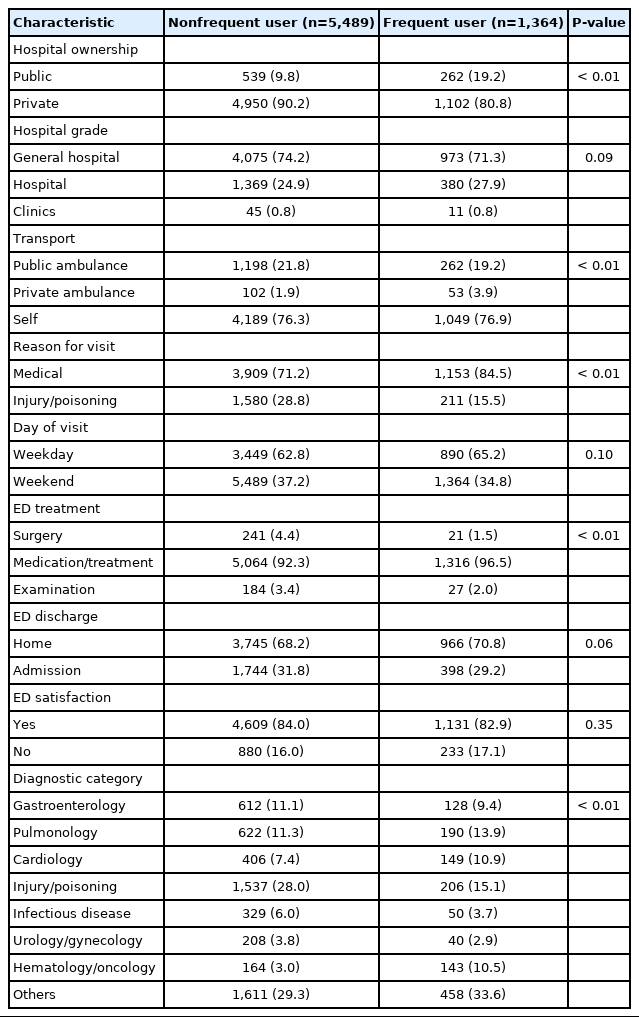
Characteristics of emergency department use in nonfrequent and frequent emergency department users
DISCUSSION
The primary role of the ED is to provide qualified and timely medical treatment for those with urgent and emergent medical conditions. However, many studies have reported that a significant proportion of ED patients visit the ED with nonurgent problems [8,9]. In a systematic review by Uscher-Pines et al. [9] the range of nonurgent visits was 8% to 62% of all ED visits. Reasons for nonurgent visits include a lack of primary care, easy accessibility, or time constraints due to work. In a previous report, frequent ED visits were associated with a higher probability of having a nonurgent problem [10]. Considering that frequent ED visits are one of the main sources of ED input and is closely related to nonurgent visits, our study may be significant in terms of providing background data.
In this study, females comprised a relatively lower proportion of frequent ED users and had a lower probability of frequent ED visits, despite a lack of statistical significance. Likewise, in a previous cross-sectional study in Korea, females showed a lower likelihood of frequent ED visits compared to males [6]. Results of sex prevalence were heterogeneous in a previous systematic review in the US [11]. Therefore, further studies are required to determine the effect of sex on frequent ED visits in Korea.
Older patients (≥65 years) comprised a higher proportion of frequent ED users, but age was not found to be a contributing factor for frequent ED visits in this study. Conversely, in a previous systematic review of the US, patients in younger age groups were more likely to be frequent ED visitors than older age groups (≥65 years) [11]. This may be explained by differences in the medical environment, such as the degree of accessibility to primary care centers or EDs.
In Korea, almost all people are beneficiaries of either national health services or medical aid. Medical aid beneficiaries are low-income individuals with a low burden on their medical costs for most medical services. In our study, those with medical aid coverage comprised a higher proportion of frequent visitors and showed relatively higher odds of frequent ED visits. We can infer that these patients have a relatively higher requirement for emergency care with the advantages of an ED, such as greater accessibility and expedited specialist consultation, even with a low burden on medical costs. Similarly in a previous report, members of the public or those with medical aid coverage were more likely to be frequent ED users [12,13].
Sun et al. [14] reported that social disadvantages such as a low level of education and unemployment were factors associated with frequent ED visits. In our study, a low level of education was prevalent in a relatively high proportion of frequent ED users, which is similar to two previous reports [13,15]. Unemployed patients were more likely to be frequent ED users and showed greater probability of frequent ED visits in our study. This result is similar to previous reports based in the US in which unemployed patients accounted for about 85% of frequent users (vs. 40% of nonfrequent users; odds ratio, 1.4) [16,17].
Patients with disabilities or chronic disease comprised a higher proportion of frequent ED users in our study. In keeping with the KHPS definitions, we operationally defined patients with either of the following conditions as having chronic disease: hypertensive disease (I10-I15 in International Classification of Diseases 10th revision, clinical modification code), diabetes mellitus-related conditions (E10-E14), disorder of lipoprotein metabolism and other lipidaemia (E78), arthropathy (M00-M25), tuberculosis (A15-A19), ischemic heart disease (I20-I25), and cerebrovascular disease (I60-I69). The link between chronic conditions/comorbidities and frequent ED visits was also found in other reports [15,18,19].
Ward admission and frequent OPD visits were found to be contributing factors associated with frequent ED visits in this study. This finding is in accordance with those of previous studies in Taiwan and Sweden [3,20]. In a study by Huang et al. [3] persistent use of the hospital OPD and the prior hospital admission was four and three times more prevalent in frequent ED users (three times per year) than single ED users. Hansagi et al. [20] reported that frequent ED users were 3.4 times more likely to use primary care facilities than nonfrequent ED users. This implies that those who have higher needs (real or patient-perceived) for healthcare tend to visit the ED more.
This study has some limitations. First, because the panel survey was conducted retrospectively, there is a potential for recall bias. However, most of the data were collected based on objective evidence, such as receipts of medical payments and medical records to minimize recall bias. Second, a few factors known to be related to frequent ED visits, such as comorbidities (heart disease or psychiatric disorders) and presence of usual sources of primary care, were not considered.
In conclusion, medical aid coverage, unemployment, ward admission in a calendar year, and frequent OPD use were associated with factors for frequent ED visits. Frequent users visited the ED of public hospitals more, and medical problems were more common reasons for visits rather than injury/poisoning. The result of our study might serve as a baseline data for future studies or policies on interventions to reduce frequent ED visits.
Notes
No potential conflict of interest relevant to this article was reported.
References
Article information Continued
Notes
Capsule Summary
What is already known
Frequent emergency department visits are one of the main sources of emergency department input, leading to emergency department overcrowding.
What is new in the current study
Older people, those with low levels of education, unemployment, low household income, medical aid coverage, prior ward admission, and frequent outpatient department use were more likely to be frequent users.