Pediatric triage modifications based on vital signs: a nationwide study
Article information

Abstract
Objective
To analyze the clinical significance of a heart rate (HR) or respiratory rate (RR) higher or lower than the normal in pediatric triage.
Methods
A retrospective observational study was conducted with data from the Korean National Emergency Department Information System. The subjects were children <15 years of age in 2016. Reported HRs and RRs were divided into seven groups: grade -3 (3 or more standard deviations [SDs]<normal), grade -2 (2 SDs<normal), grade -1 (1 SD<normal), grade 0 (normal), grade 1 (1 SD>normal), grade 2 (2 SDs>normal), and grade 3 (3 or more SDs>normal). The main outcomes were hospitalization and intensive care unit (ICU) admission rates. Logistic regression analysis was used to analyze the relationship of the outcomes according to grade in each group.
Results
Data for 981,297 patients were analyzed. Hospitalization and ICU admission rates increased significantly in the higher HR group (grades 1 to 3; odds ratio [OR], 1.353; P<0.001; OR, 1.747; P<0.001; respectively) and in the higher RR group (OR, 1.144; P<0.001; OR, 1.396; P<0.001; respectively), compared with grade 0 group. In the lower HR group (grades -1 to -3), the hospitalization rate decreased (OR, 0.928; P<0.001), whereas the ICU admission rate increased (OR, 1.207; P=0.001). Although the hospitalization rate increased. In the lower RR group (OR, 1.016; P=0.008), the ICU admission rate did not increase (OR, 0.973; P=0.338).
Conclusion
Deviations in HR and RR above normal are related to increased risks of hospitalization and ICU admission. However, this association may not apply to deviations below normal.
INTRODUCTION
The Canadian Triage and Acuity Scale (CTAS) is widely used around the world [1], and the pediatric CTAS (PedCTAS) was developed specifically for pediatric populations [2]. In the 2008 revision, the PedCTAS introduced the concept of triage modification for specific chief complaints, and the modifiers included heart rate (HR) and respiratory rate (RR) [3].
Triage modification is applicable only when it corresponds to at least one of the chief complaints specified in the PedCTAS guidelines, and the following criteria are used to determine whether to adjust the triage acuity level: HR and RR within the normal range for age indicate PedCTAS level 4 or 5; HR and RR 1 standard deviation (SD) outside the normal range indicate PedCTAS level 3; and HR and RR 2 SDs and 3 SDs outside the normal range indicate PedCTAS levels 2 and 1, respectively [1,4]. There is evidence to support varying the acuity level according to the degree that HR or RR deviates from the normal ranges. However, even if the degree of deviation is identical, the clinical significance may differ according to whether the values are above or below normal. It is therefore necessary to verify the current scale, which assumes that triage acuity is uniformly affected by the degree of deviation and not the direction of deviation. A few studies provide data regarding this issue. This study was conducted to determine whether the clinical significance and outcome of emergency department (ED) visits differ according to the direction that HR or RR deviates from normal, even if the degree of deviation is the same.
METHODS
Ethics statement
The present study protocol was reviewed and approved by the Institutional Review Board of Seoul National University Hospital (No. H-2012-114-1183). Informed consent was waived due to the retrospective nature of the study and because the analysis used anonymous clinical data.
Data source and collection
This retrospective observational study was conducted with data provided by the National Emergency Department Information System (NEDIS), a national database in Korea that receives real-time information on patients visiting EDs at medical institutions nationwide. Data collected from all regional and local emergency medical centers from January to December 2016 were accessed, and patients younger than 15 years of age were enrolled in this study. Patients with a chief complaint for which triage modification was not applicable and patients missing data for both HR and RR were excluded. Data including demographics, HR, RR, and ED disposition were collected. Because NEDIS data are anonymized, it is impossible to know which patient cases were collected from which center, and it is not possible to determine how HR and RR were measured. However, when measuring initial vital signs in the ED in Korea, HR is usually recorded by a noninvasive blood-pressure measuring device or pulse oximetry, and RR is measured primarily by a visual count for 1 minute.
Data preprocessing
The triage system used in this study, Pediatric Korean Triage and Acuity Scale (PedKTAS), is based on PedCTAS and developed in collaboration with the CTAS National Working Group. By 2016, all EDs in Korea utilized PedKTAS. At that time, PedCTAS was adopted and applied with minimal modification, other than Korean translation. The main symptoms indicating a need for triage modification, modification criteria, and normal ranges for HR and RR by age were the same as those in PedCTAS [5].
According to the PedCTAS participant manual, HR and RR by age are divided into four groups: “normal range,” “1 SD from (> or <) normal range,” “2 SDs from (> or <) normal range,” and “3 or more SDs from (> or <) normal range.” [4] However, in this study, both the degree of deviation from normal and the direction of deviation were analyzed. Depending on whether the HR and RR values were above or below the normal range, patients were assigned to the “higher” or “lower” group, respectively. The grades were then reclassified for each group. For example, grade 1 in the higher group was “1 SD>normal range” and grade 1 in the lower group was “1 SD<normal range.”
Age groups were divided according to US criteria as follows: infancy was defined as between birth and 2 years of age, childhood was from 2 to 12 years of age, and adolescence was from 12 to 15 years of age. Although the latter definition in the cited reference is from 12 to 21 years old; in this study, children younger than 15 years of age were targeted, and the definition was changed to 12 to 15 years old [6].
Hospitalizations included patients admitted directly to the operating room, general ward, or intensive care unit (ICU) and those transferred to another hospital for admission. Admissions to ICUs included all admissions directly from the ED, admissions after passing through the operating room, and transfer to another hospital for ICU admission.
Outcomes
The outcomes of this study were change in hospitalization rate and ICU admission rate according to HR and RR grades. The outcomes in the higher and lower group were compared with each other. In addition to the classification of the higher or lower groups, subgroup analysis was performed to determine how the above outcomes changed by age group or trauma.
Statistical analysis
Continuous variables were described as mean±standard deviation if they followed a normal distribution, and as median (interquartile range [IQR]) if they did not. Categorical variables were described as number (%). Logistic regression analysis was used to analyze the relationship of the outcomes according to grade in each group. P-values less than 0.05 were considered statistically significant, and R ver. 4.0.3 (R Foundation for Statistical Computing, Vienna, Austria) was used for all statistical analyses.
RESULTS
Records for 1,448,466 patients were reviewed and, after applying the exclusion criteria, data from 981,297 patients were used in the final analyses (Fig. 1). The median (IQR) age was 3 (1–6) years, and 43% were girls. Table 1 provides the baseline characteristics of the study population.

Participant flow chart.
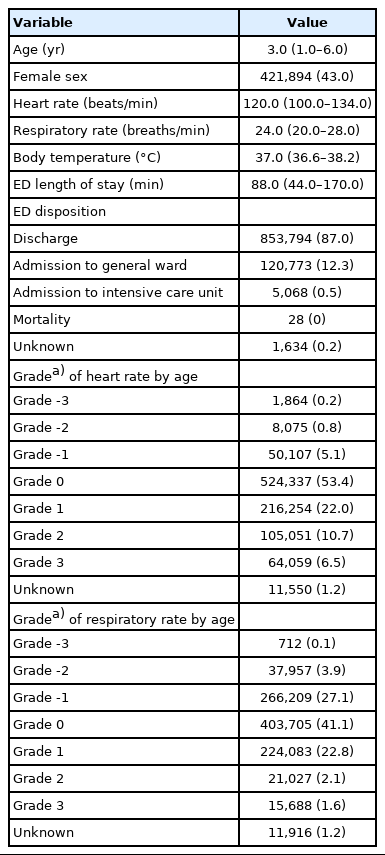
Baseline characteristics of the study population (n=981,297)
In the higher group, both the hospitalization rate and the ICU admission rate increased significantly with higher HR grade (odds ratio [OR], 1.353; 95% confidence interval [CI], 1.345–1.361; P<0.001; OR, 1.747; 95% CI, 1.704–1.791; P<0.001; respectively) and higher RR (OR, 1.144; 95% CI, 1.133–1.156; P<0.001; OR, 1.396; 95% CI, 1.340–1.455; P<0.001; respectively). In the lower group, the ICU admission rate increased with lower HR grade, and the hospitalization rate increased with lower RR grade (OR, 1.207; 95% CI, 1.084–1.345; P=0.001; OR, 1.016; 95% CI, 1.004–1.028; P=0.008; respectively). However, the change in the ICU admission rate according to the increase in RR grade was not statistically significant (OR, 0.973; 95% CI, 0.920–1.029; P=0.338), and the hospitalization rate significantly decreased as the HR grade increased (OR, 0.928; 95% CI, 0.908–0.949; P<0.001) (Fig. 2 and Table 2).
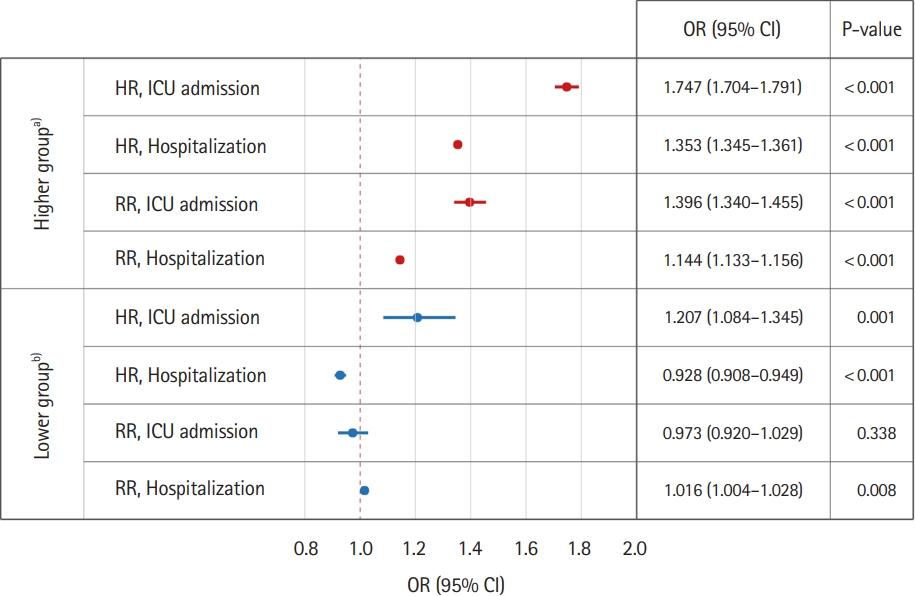
Emergency department disposition according to grade of age-specific heart rate (HR) and respiratory rate (RR). Logistic regression analysis results of each outcome as each vital sign deviated from the normal range. OR, odds ratio; CI, confidence interval; ICU, intensive care unit. a)Above or equal to the normal range. b)Below or equal to the normal range.

Outcomes according to grade of vital signs by age
Demographic data for subgroups according to age group and trauma are shown in Supplementary Table 1. Hospitalization and ICU admission rates by age group are presented in Supplementary Table 2, and outcomes according to trauma are indicated in Supplementary Table 3. Although there were some numerical differences by subgroup, the degree of deviation and outcomes were generally related in the higher group. No consistent correlation was evident in the lower group.
DISCUSSION
This study found that, even if HR or RR deviated by the same degree from normal, the clinical significance differed depending on whether the deviation was above or below the normal range. In general, common sense suggests that abnormal vital signs indicate a deterioration in a patient’s condition; the more vital signs deviate from normal, the more abnormal they are and the greater the degree of deterioration. The results of this study provide objective evidence to support this assumption.
In the higher group, the hospitalization and ICU admission rates increased as both the HR and RR deviated from the normal range, whereas the same results were not observed in the lower group. When the HR or RR was above normal, the deviation was significantly associated with deterioration of the patient’s condition; however, when the deviation was below normal, the relationship disappeared. In a case-controlled study of adult patients admitted to the ED, an increased RR was a predictor of early clinical deterioration [7]. Another retrospective study on the clinical significance of RR in patients with community-acquired pneumonia found that an increased RR was an important factor associated with increased in-hospital mortality [8]. These two studies showed that an increase in RR is associated with patient deterioration, which agrees with the results of this study. With regard to HR, a retrospective study of children showed that bradycardia alone was a poor predictor of severe worsening of the condition of a patient [9]. That study did not directly compare tachycardia and bradycardia, and caution should be used when interpreting the results. However, the results suggest a need to reconsider the idea that bradycardia is directly related to patient deterioration.
The results of additional analysis to determine whether there would be different results depending on the child’s age or presence of trauma were also slightly different for each subgroup but not significantly different from the overall analysis results. In the higher group, increases in severity were proportional to the degree of deviation, but the lower group did not show a consistent trend. It is beyond the scope of this study to determine the cause of these different characteristics in higher and lower groups due in part to the anonymized public dataset. However, a few causes are worth considering. First, one of the most common chief complaints among children visiting an ED is fever [10], which can increase HR and RR [11-15]. Hospitalization for the treatment of febrile disease or even ICU admission in case of severe disease such as septic shock can therefore be expected. However, bradycardia or bradypnea may appear in a stable situation in which the parasympathetic nervous system is stimulated, rather than in a pathological or stressful situation in which the sympathetic nervous system is hyperactive [16]. Assessing the worsening of a patient’s condition using only the above signs may therefore be inadequate. In one pediatric bradycardia study, bradycardia in the absence of a cardiac anomaly or decreased cardiac function had little predictive power to predict patient exacerbation [9]. Separate analysis of patients with and without cardiac disease may have resulted in a significant finding that bradycardia in patients with cardiac disease is more likely to result in hospitalization or admission to an ICU. However, because this is beyond the scope of this study, it would be good to conduct it in a subsequent study.
This study has several limitations. First, it focused on the effects of the HR or RR grade on the hospitalization rate or ICU admission rate; other factors that can affect hospitalization were not investigated. However, data from this study were obtained from a public database in which patients were anonymized, which is a limitation inherent in such research. To minimize the influence of factors other than HR and RR, we narrowed the analytical targets to patients with chief complaints indicative of a need for triage modification according to HR and RR. Second, the effect of abnormal vital signs on ED disposition differed according to whether the deviations were above or below the normal range, and no detailed analysis was conducted on the adjustment of the weight for each deviation. Third, whether the measurement methods of HR and RR were uniformly used is not known. Human error can be minimized because conventional HR measurement employs a noninvasive blood-pressure measurement device or a pulse oximetry. However, because RR was measured primarily by a subjective visual count rather than objective measurement through an end-tidal carbon dioxide monitoring device, the accuracy may be limited. Because neither PedCTAS nor PedKTAS provides a specific method for measuring HR or RR, we assumed that there would be no difficulty in deriving the result even if the measurement method was slightly different for each institution. Fourth, in the process of excluding cases in which both HR and RR were missing, a significant portion of cases were excluded. This was an essential process in this study to analyze the effect of HR or RR among cases where triage modification is possible, but it contains the possibility of selection bias. Lastly, it is difficult to completely rule out the possibility that the higher and lower groups have an imbalance in sample size, etc., which may have affected the result derivation.
In conclusion, deviations in both HR and RR above the normal range were related to increased risks of hospitalization and ICU admission. However, these associations may not be apply when the deviations were below the normal range. These findings strongly suggest that the assumptions underlying current triage modifications based on HR and RR should be modified to include the direction of the deviation.
SUPPLEMENTARY MATERIAL
Baseline characteristics for each subgroup
Comparison of emergency department disposition of higher and lower groups according to age group
Comparison of emergency department disposition of higher and lower groups according to the presence of trauma
Supplementary materials are available at https://doi.org/10.15441/ceem.21.108.
Notes
CONFLICT OF INTEREST
No potential conflict of interest relevant to this article was reported.
FUNDING
None.
References
Article information Continued
Notes
Capsule Summary
What is already known
In the Pediatric Korean Triage and Acuity Scale, abnormal vital signs are supposed to raise the triage level in 1 standard deviation increments as they deviate from the center. Regardless of whether it is higher or lower than normal, if the degree of deviation from normal is the same, it is treated the same. However, there is no medical evidence for this.
What is new in the current study
In this study, effects of higher or lower heart rate and respiratory rate on the emergency department disposition were investigated, and only higher heart rate or respiratory rate were associated with hospitalization/intensive care unit admission rate.