Serum phosphate is not an early predictor of neurocognitive outcomes in acute carbon monoxide poisoning patients
Article information

Abstract
Objective
Carbon monoxide (CO) poisoning causes brain injury by hypoxia and inflammatory mechanisms. Hypoxic conditions result in increased serum phosphate concentration due to loss of polarity of the cell membrane, changes in membrane fluidity, and consequent destruction of phospholipids in the cell membrane. This study aimed to evaluate whether serum phosphate measured in the emergency department (ED) can serve as an early predictor of neurocognitive sequelae 1 month after acute CO poisoning.
Methods
We included patients ≥16 years with acute CO poisoning from a cohort who were treated at a single tertiary academic hospital in Wonju, Korea, between January 2006 and May 2021. Neurocognitive outcome was assessed using the Global Deterioration Scale score; patients were classified into favorable (1–3 points) or poor (4–7 points) neurocognitive outcome groups based on this score. These two groups were compared before and after propensity score matching.
Results
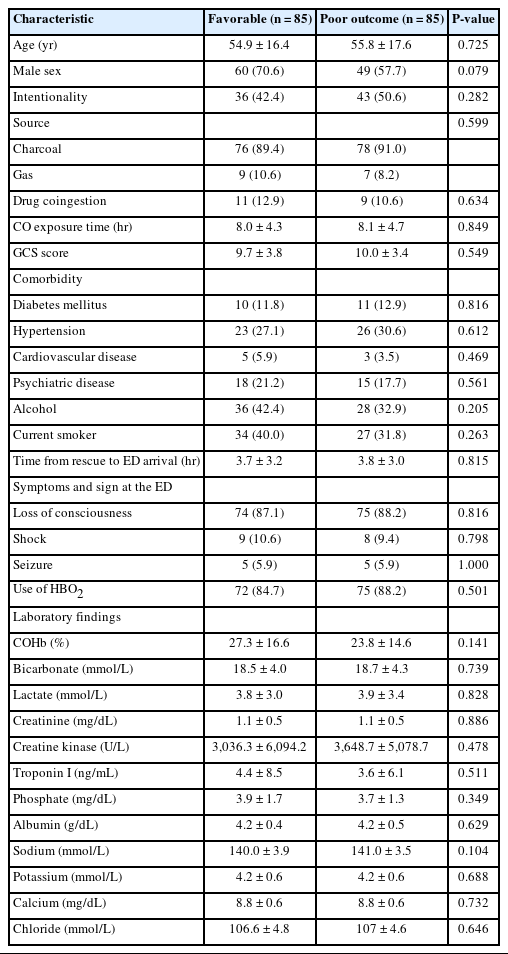
Data from 888 patients were analyzed. Seven hundred seventy-one patients (86.8%) were assigned to the favorable outcome group and 117 patients (13.2%) to the poor outcome group. Patients with a poor outcome had a higher mean serum phosphate level than those with a favorable outcome (3.9 mg/dL vs. 3.5 mg/dL, P=0.001). Propensity score matching yielded 85 matched patient pairs. After matching, serum phosphate level in the ED was not significantly different between the favorable and poor outcome groups (3.9 vs. 3.7 mg/dL, P=0.349).
Conclusion
Serum phosphate level measured in the ED did not predict poor neurocognitive outcomes 1 month after CO poisoning.
INTRODUCTION
Carbon monoxide (CO) poisoning causes tissue hypoxia due to its affinity for hemoglobin, in addition to direct inflammatory damage to tissues through various mechanisms [1,2]. CO binds competitively to heme-containing proteins such as hemoglobin and myoglobin as well as mitochondrial cytochrome c oxidase (complex IV), resulting in tissue hypoxia [1]. Therefore, CO poisoning damages organs that are heavily reliant on oxygen such as the brain, heart, and muscles [3].
Patients with neurocognitive sequelae caused by CO poisoning may present with symptoms such as mental deterioration, cognitive dysfunction, amnesia, gait disturbance, mutism, urinary or fecal incontinence, psychosis, depression, and Parkinsonism [2,4-6]. Hyperbaric oxygen therapy (HBO2) within 24 hours after poisoning is recommended for symptomatic patients with CO poisoning based on previous randomized control trials [7,8]. Weaver et al. [8] reported that HBO2 use (compared to nonuse) in patients with CO poisoning reduced neurocognitive sequelae at 6 weeks. However, neurocognitive sequelae developed in 25% of patients with acute CO poisoning even with HBO2 use. Therefore, it is important to be able to predict poor neurocognitive outcomes in patients with acute CO poisoning. Patients at high risk for neurocognitive sequelae must be screened for follow-up to allow for early initiation of rehabilitative interventions [9]. In addition, early prediction of poor neurocognitive outcomes would help clinicians plan monitoring and treatment strategies [10].
Various biomarkers for neurocognitive prognosis in CO poisoning patients have been explored, including serum S100ß protein [11,12], neuron-specific enolase [13], and myelin basic protein in cerebrospinal fluid [14]. However, while these tests can predict prognosis, they are difficult to apply in the emergency department (ED).
Phospholipids, a major element of cell membranes and nucleic acids, contain phosphate groups, and phosphate-containing compounds play essential roles in multiple physiological processes including cellular signal transduction, mineral metabolism, and energy exchange [10]. Previous studies have reported that ischemic or hypoxic conditions result in loss of polarity of the cell membrane, changes in membrane fluidity, and consequently destruction of phospholipids in the cell membrane, resulting in increased phosphorus concentrations in blood [15,16]. In addition, under ischemic conditions, inefficient adenosine triphosphate production by anaerobic metabolism increases the level of inorganic phosphate, leading to an increase in serum phosphate [17,18]. Given the positive relationship between phosphate levels and the severity of ischemic injury in conditions such as intestinal ischemia, myocardial infarction, and cardiac arrest [19-25], it is plausible that higher phosphate levels may be associated with poorer outcomes in acute CO poisoning patients by reflecting the severity of hypoxic stress.
We hypothesized that higher serum phosphate levels assessed in the ED would correlate with worse neurocognitive outcomes in patients with CO poisoning. No previous studies have investigated the clinical usefulness of serum phosphate as an early predictor of poor neurocognitive outcomes in patients with acute CO poisoning. Therefore, the aim of this study was to evaluate the ability of serum phosphate measured in the ED to serve as a biomarker for early prediction of neurocognitive sequelae 1 month after acute CO poisoning.
METHODS
Study design and setting
The data used in our study were derived from a cohort treated at a single tertiary academic hospital in Wonju, Korea. In January 2006, a CO poisoning registry was opened to prospectively collect patient data in our hospital. Data from January 2006 to July 2020 were obtained from this registry, and data after August 2020 were collected prospectively with informed consent for the CARE CO cohort (ClinicalTrials.gov identifier: NCT04490317). We analyzed data collected between January 2006 and May 2021. The study was approved by the Institutional Review Board of Wonju Severance Christian Hospital (No. CR319133) and complied with the ethical guidelines of the Declaration of Helsinki. We anonymized patient data before the analyses.
The following criteria were used for exclusion: (1) less than 16 years old, (2) previous CO poisoning history, (3) a history of previous neurocognitive dysfunction such as stroke, dementia, or Parkinson’s disease before acute CO poisoning, (4) specific additive treatment such as therapeutic hypothermia or steroids, (5) serious illness such as advanced cancer, (6) insufficient data for important variables including serum phosphate, (7) preexisting parathyroid disease, as this could influence phosphate levels, (8) failure to follow-up neurocognitive status after discharge, and (9) fire as the CO source.
In our institution, acute CO poisoning is diagnosed based on the patient’s medical history and carboxyhemoglobin (COHb) >5% (for smokers, >10%). We treated patients with CO poisoning with 100% oxygen therapy through a face mask with a reservoir bag. Patients with any interval of loss of consciousness, neurocognitive symptoms or signs, cardiovascular dysfunction, elevated cardiac enzymes, ischemic electrocardiogram changes, severe acidosis, or COHb ≥25% were treated with HBO2 [26].
Study variables and definitions
We evaluated the following clinical variables in CO poisoning patients: age, sex, intentionality of poisoning, source of CO (charcoal, oil, or gas), drug coingestion, maximal CO exposure time, initial Glasgow Coma Scale (GCS) at the site of rescue or ED arrival, comorbidities (diabetes mellitus, hypertension, cardiovascular diseases, and psychiatric diseases), alcohol coingestion, current smoker, symptoms and signs (loss of consciousness, shock, and seizure), and use of HBO2. Shock was defined as use of a vasopressor and lactate level greater than 2 mmol/L [27]. CO exposure duration was the estimated maximum duration of CO exposure measured from the time of normal consciousness to patient detection.
Laboratory parameters collected were serum COHb, bicarbonate, lactate, creatinine kinase, troponin I, and phosphate measured within 1 hour of ED arrival. Other electrolytes (sodium, potassium, calcium, and chloride) and variables that could affect phosphate levels (creatinine and albumin) were also measured [28]. In our institution, serum phosphate level is measured during routine laboratory tests using Atellica Solution IM analyzers or Atellica Solution CH analyzers (Siemens Healthineers, Erlangen, Germany).
Neurocognitive outcome was assessed using the Global Deterioration Scale (GDS) [29] during a rehabilitation outpatient visit. This scale was also used to determine the prognosis of patients with CO poisoning [30-32]. If the patient was unable to visit the outpatient department due to deteriorated condition, the patient’s caregivers were interviewed. GDS score ranges from 1 to 7, where a higher score indicates a more severe condition (Supplementary Method. 1 and Supplementary Table. 1). GDS scores were classified as favorable (1–3 points) or poor (4–7 points) [30-32]. If a patient died from CO poisoning (CO-related death) within 1 month, a GDS score of 7 was assigned. Patients who died of causes unrelated to CO poisoning were considered to have missing GDS values and were thus excluded from the analyses.
Statistical analysis
Summary statistics are reported as mean±standard deviation for numerical variables and as number (%) for categorical variables. Continuous data were compared using independent t-tests or Mann-Whitney U-tests, while categorical data were compared using Pearson chi-square tests or Fisher exact tests. The Shapiro-Wilks test was used to determine whether continuous variables were normally distributed.
To reduce the effect of selection bias and potential confounders, we used propensity score matching (PSM) to adjust for significantly different variables combined with clinically important variables related to the severity of CO poisoning (age, CO exposure time, GCS, diabetes mellitus, hypertension, loss of consciousness, shock, seizure, bicarbonate, lactate, creatinine, creatine kinase, and troponin I levels) [33]. However, when many variables are included in propensity score matching, it is difficult to match covariates [34]. For balanced matching, we used a greedy matching algorithm (without replacement) with a caliper width of 0.05 standard deviations of the log odds of the estimated propensity score [35], and performed 1:1 matching rather than 1:n matching [36]. After all PSM procedures were performed, we compared baseline covariates between groups. Continuous variables were compared using paired t-tests or Wilcoxon signed-rank tests, as appropriate, and categorical variables were compared using McNemar tests. Univariable linear regression was performed to assess if there was a linear relationship between GDS score and serum phosphate level. The relationship between serum phosphate level and neurocognitive outcomes was assessed using two multivariable logistic regression models. Models 1 and 2 were adjusted by matching variables and variables found to be significant in univariate analysis, respectively.
All reported P-values are two-sided, and P-values <0.05 were considered statistically significant. SAS ver. 9.4 (SAS Institute Inc., Cary, NC, USA), and R ver. 3.6.3 (R Foundation for Statistical Computing, Vienna, Austria) were used for statistical analyses.
RESULTS
Characteristics of the study population
Among the 1,790 patients with acute CO poisoning, 888 patients were finally included in this study (Fig. 1). According to the 1-month GDS results, patients were divided into two groups: a favorable outcome group (771 patients, 86.8%) and a poor outcome group (117 patients, 13.2%).

Study flow diagram. CO, carbon monoxide.
Baseline characteristics of included patients according to outcome are shown in Table 1. Patients with a poor outcome were older than those with a favorable outcome. Additionally, patients with poor outcome had longer CO exposure times and lower GCS scores. The poor outcome group had more patients with diabetes mellitus and hypertension than the favorable outcome group. Furthermore, poor outcome patients were more likely to have experienced loss of consciousness, shock, or seizure. Laboratory results are also shown in Table 1. Patients with a poor outcome had higher levels of lactate, creatinine, creatine kinase, troponin I, phosphate, sodium, and potassium than those with a favorable outcome. Bicarbonate and calcium levels were higher in patients with favorable outcomes.

Baseline characteristics of the propensity score matched and unmatched cohorts
We investigated whether the 1-month GDS score changed after 1 year (86 patients were lost to follow-up at 1 year). The GDS score of 674 patients of 802 patients (84.0%) remained unchanged. Eighteen patients (2.3%) had an improved GDS score while 20 patients (13.7%) had a worse GDS score.
Characteristics of patients matched based on propensity scores
After performing 1:1 PSM with 13 covariates for the entire population, we obtained 85 matched patient pairs. The balance of covariates between the groups was checked (Supplementary Fig. 1). There were no significant differences between favorable and poor outcome groups for any covariate after PSM (Table 1).
Main outcomes for the matched cohorts
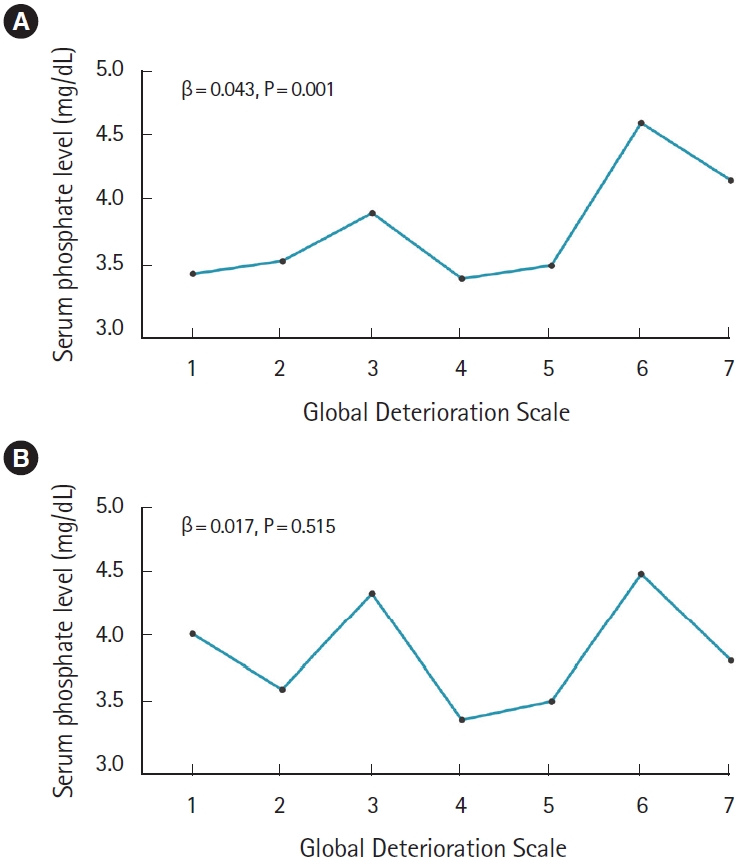
Table 1 and Fig. 2 show comparisons of serum phosphate level according to neurocognitive outcomes 1 month post-CO exposure in the overall matched cohort. There was no significant difference in serum phosphate level between the favorable and poor outcome groups (P=0.349). Additionally, serum phosphate did not have statistically significant linear trend at 1 month after CO poisoning (β=0.017, P=0.515) (Fig. 3). The odds ratio for a poor GDS (≥4) at 1 month according to serum phosphate level showed a significantly increasing trend for serum phosphate levels of 3 mg/dL or higher. However, after matching, the odds ratio tended to decrease and there were no significant differences for any of the serum phosphate intervals (Fig. 4).
Comparison of serum phosphate levels at 1 month (A) before and (B) after propensity score matching.

Linear trends in serum phosphate levels according to changes in Global Deterioration Scale (GDS) scores at 1 month (A) before and (B) after propensity score matching.
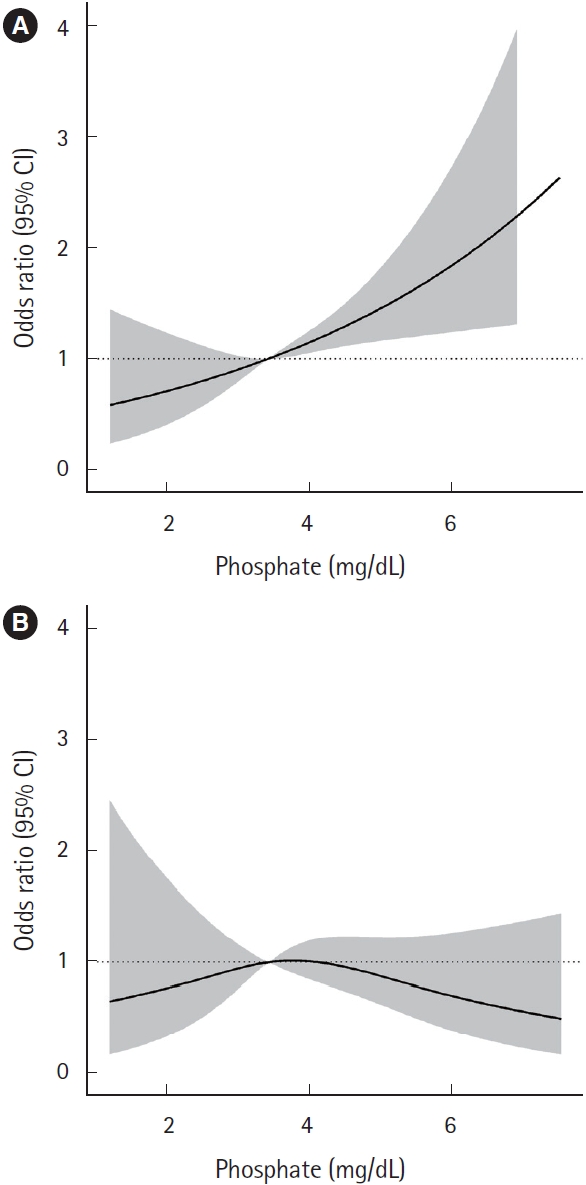
Smoothing restricted cubic splines plot of the odds ratio of a poor neurocognitive outcome based on logistic regression (A) before and (B) after propensity score matching. CI, confidence interval.
Additional analyses
We performed additional analysis to evaluate the ability of serum phosphate level to predict neurocognitive sequelae at an early stage after CO poisoning. In multivariable logistic regression models, serum phosphate was not a significant predictor of a poor prognosis (Table 2). In addition, in the cohort matched based on variables without laboratory tests unrelated to CO exposure (bicarbonate, lactate, creatinine, creatine kinase, and troponin I), serum phosphate was not a significant predictor of poor neurocognitive outcomes (Table 3).
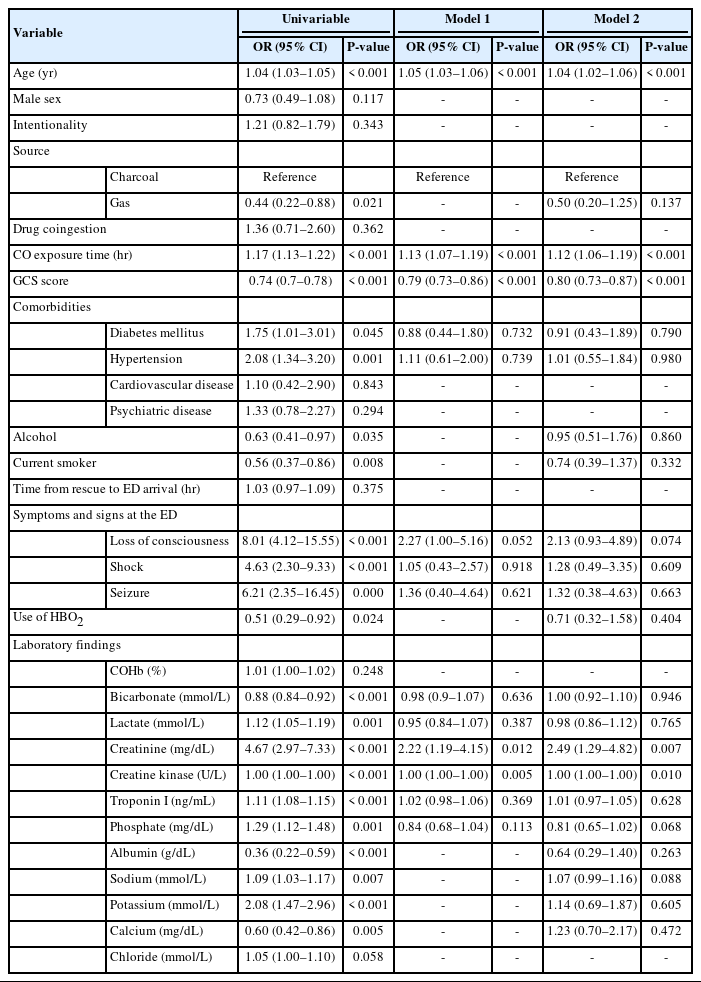
Multivariable logistic regression analysis to evaluate predictors of a poor neurocognitive prognosis
Baseline characteristics of cohorts by the propensity score matching without laboratory variables
DISCUSSION
In this study, serum phosphate level was significantly higher in those patients with a poor outcome before PSM. However, serum phosphate level did not show a significant association with a poor outcome after PSM for factors related to the severity of CO poisoning. In addition, serum phosphate was not a significant predictor of poor outcome in multivariable logistic regression models. This means that serum phosphate level alone cannot predict a poor outcome 1 month after acute CO poisoning. A few studies have reported increased serum phosphate levels in various hypoxia-related diseases. In cardiac arrest patients, serum phosphate is known to be related to prognosis [10,20,23]. High phosphate levels have also been reported in patients with intestinal ischemia [37,38], and correlations between serum phosphate levels and morbidity and mortality in coronary artery disease patients have been reported [25,28,39]. However, despite years of study, use of serum phosphate level for early diagnosis of acute intestinal ischemia is still controversial and is not a routine diagnostic test [40].
We attribute the fact that serum phosphate was not useful for predicting the prognosis of acute CO poisoning patients to the following factors. First, serum phosphate is known to be elevated according to the degree of hypoxia. However, the hypoxic insult of acute CO poisoning may not be as severe as that of cardiac arrest in which severe ischemia occurs due to complete blockage of oxygen supply. That is, the hypoxia of CO may not be severe enough to cause a significant change in serum phosphate level. In general, serum lactate is known to reflect tissue hypoxia [41]. However, in this study, lactate was not a significant prognostic factor of a poor outcome (Supplementary Fig. 2). This suggests that the degree of hypoxia in CO poisoning is not severe enough to result in significant changes in laboratory variables. Second, the known pathophysiology of acute CO poisoning involves not only hypoxia but also inflammatory reactions such as platelet-neutrophil activation, oxidative stress, and cell apoptosis [1,2], which serum phosphate levels do not reflect. Serum phosphate level in addition to laboratory parameters related to the inflammation associated with acute CO poisoning may result in a better predictive model. Third, it takes time for serum phosphate levels to rise after the onset of ischemia, but it is unclear what the appropriate timing is for phosphate measurement to reflect hypoxic damage. In some studies, elevated serum phosphate levels were reported starting within 1 hour of intestinal ischemia [19,42]. However, other studies reported an increase in serum phosphate levels only 3 to 4 hours after ischemia [24,43]. In an intestinal ischemia study, phosphate levels measured in the early stage of ischemia were not significantly different from baseline, but there was a significant increase in irreversible intestinal necrosis due to persistent ischemia [24]. In the current study, considering the relatively short COrelated hypoxic times and the differences in timing of blood collection for the serum phosphate test after CO exposure, phosphate level may not have had a sufficient time to become elevated. Fourth, phosphate levels in rescued CO poisoning patients may trend towards baseline after resumption of oxygen supply. It should also be noted that serum phosphate level is rapidly regulated by three organs: the parathyroid, kidneys, and bone [44]. Elevated phosphate level resulting from CO exposure may be downregulated by these organs during rescue and transport to the hospital.
The study had several limitations. First, it was an observational, nonrandomized study. Hidden bias may therefore be present due to the effects of unmeasured confounders. Second, although a few randomized control trials have conducted multiple neurocognitive tests (approximately six tests usually equivalent to CO screening batteries) [7,8], we only evaluated outcomes using the GDS. Our institution uses the GDS score to determine the neurocognitive prognosis of patients with CO poisoning because it assesses neurocognitive functions, such as memory and concentration, as well as activities of daily living, through interviews. We previously reported the GDS as a neurocognitive outcome in a study related to CO poisoning [30-32]. Third, continuous serum phosphate was not measured. The relationship between serum phosphate over time and poor neurologic outcome after CO poisoning was not investigated. Continuous observation of serum phosphate may reveal an unknown relationship between CO poisoning and serum phosphate level. We performed additional analysis of the interval between rescue from the CO source and sampling at the ED. However, the differences in serum phosphate between these time points and neurocognitive outcome were not statistically significant (Supplementary Table. 2). Fourth, we were unable to obtain information about parathyroid hormone or serum magnesium and vitamin D levels, which could affect phosphate levels.
In conclusion, serum phosphate level evaluated at the ED did not predict poor neurocognitive outcomes 1 month after CO poisoning.
SUPPLEMENTARY MATERIAL
Global Deterioration Scale
Global Deterioration Scale
Subgroup analysis
Density plot of propensity scores according to presence of poor neurological outcome. (A) Before and (B) after propensity score matching.
Prognostic power for poor neurocognitive outcome by area under the receiver operator characteristic curve.
Supplementary materials are available at http://doi.org/10.15441/ceem.22.299.
Notes
CONFLICT OF INTEREST
No potential conflict of interest relevant to this article was reported.
FUNDING
This work was supported by the National Research Foundation (NRF) grant funded by the Korean government (the Ministry of Science and ICT) (No. NRF-2021R1A2C2004922).
References
Article information Continued
Notes
Capsule Summary
What is already known
Carbon monoxide poisoning causes tissue hypoxia due to its affinity for hemoglobin, and direct inflammatory damage to tissues through various mechanisms. Hypoxic conditions result in increased serum phosphate concentrations due to loss of polarity of the cell membrane, changes in membrane fluidity, and consequent destruction of phospholipids in the cell membrane.
What is new in the current study
Serum phosphate level in blood evaluated in the emergency department did not predict poor neurocognitive outcomes at 1 month after carbon monoxide poisoning.