The effect of regional distribution of isolation rooms in emergency departments on ambulance travel time during the COVID-19 pandemic
Article information

Abstract
Objective
The number and distribution of isolation rooms in Korea differ by region. The distribution of isolation beds in emergency departments may have affected ambulance travel time and burden on emergency medical service (EMS) during the COVID-19 pandemic.
Methods
This retrospective observational study analyzed EMS records in four regions of the Gyeonggi Province, Korea, from January 01, 2019 to December 31, 2020. The main exposure was the number of emergency department isolation rooms in each region. The primary outcome was call-to-return time for the EMS. The interaction effect of the number of regional isolation rooms on the call-to-return time during the COVID-19 pandemic was analyzed using a generalized linear model (GLM) and logistic regression.
Results
A total of 781,246 cases was included in the analyses. During the COVID-19 pandemic, the call-to-scene time (before 8 minutes vs. after 9 minutes, P<0.05) and call-to-return time (before 46 minutes vs. after 52 minutes, P<0.05) for emergency patients increased significantly compared to before the pandemic. As the number of regional isolation rooms increased, the effect of COVID-19 on the call-to-return time decreased significantly in the multivariable GLM with an interaction term (with 10.14 isolation rooms per million population: adjusted exponential β coefficient [exp(β)], 1.33; with 12.24 isolation rooms per million population: adjusted exp(β), 1.18). As the number of regional isolation rooms increased, the effect of COVID-19 on the call-to-scene time decreased significantly in the multivariable GLM with an interaction term (with 10.14 isolation rooms per million population: adjusted exp(β), 1.20; with 12.24 isolation rooms per million population: adjusted exp(β), 1.09).
Conclusion
During the pandemic, the increases in call-to-return time and call-to-scene time were smaller in regions with more isolation rooms per population.
INTRODUCTION
COVID-19 is a novel infectious disease caused by the SARS-CoV-2 virus and has spread across the world [1,2]. In Korea, the community spread of COVID-19 was confirmed on February 20, 2020 [3]. The burden on the entire emergency medical system increased during the COVID-19 pandemic [4,5], especially for the prehospital stage, where delays in hospital transport of emergency patients were reported [6–8]. Kim et al. [9] reported that the hospital transport time for patients with suspected acute stroke with neurological deficits was delayed by 4 minutes during the COVID-19 pandemic. Additionally, according to Lim et al. [10], the emergency medical service (EMS) response time for out-of-hospital cardiac arrest patients was significantly delayed, and the survival rates decreased. Therefore, the EMS response and transfer times increased, increasing their burden and affecting patient prognosis during the pandemic.
The EMS is tightly associated with regional emergency medical resources. Isolation rooms of an emergency institution are an essential resource for treating patients with suspected COVID-19 symptoms, including fever and respiratory symptoms [11,12]. In Korea, the minimum number of isolation rooms in an emergency department (ED) is stipulated by law according to the tier of the emergency medical institution. However, as most emergency medical institutions in Korea are private hospitals, there is an imbalance of emergency medical institutions between regions. Consequently, the distribution of isolation rooms differs by region, which may affect the prehospital transport phase of patients and the burden on EMS. This study was conducted to analyze the effect of the imbalance in emergency medical resource distribution between regions on the prehospital stage during the COVID-19 pandemic. For this purpose, the effect of the number of isolation rooms by region on ambulance travel time of EMS during the COVID-19 pandemic was analyzed.
METHODS
Study design
This was a retrospective, observational study of patients who used the 119 service, which is the EMS operated by the Korean government, in four regions of Gyeonggi Province—northeast, northwest, southeast, and southwest—from January 1, 2019 to December 31, 2020. All ambulance run sheets recorded by the EMS crew were analyzed, and the cases including call time, dispatch time, scene arrival time, and return time were analyzed. The main exposure was the number of isolation rooms in the region. The primary outcome was the change in elapsed time interval from call time to station return time (call-to-return time) before and after the COVID-19 pandemic started on February 23, 2020, when Korea’s COVID-19 crisis alert level was raised to severe.
Study setting
The emergency medical centers (EMCs) in Korea have three emergency levels: regional EMCs (REMCs), local EMCs (LEMCs), and local emergency medical agencies (LEMAs). Conceptually, this is a sequential emergency medical delivery system that treats the most serious patients at REMCs and moderate or mild emergency patients at regional institutions, including LEMCs and LEMAs. According to the Emergency Medical Service Act, Korea is divided into 29 emergency medical regions in accordance with residential areas, and 38 REMCs were in operation in January 2021. The minimum requirements for emergency medical resources, including human resources and isolation rooms, were specified according to the EMC level. LEMAs do not need isolation rooms; LEMCs must have at least one negative-pressure isolation room and two isolation rooms; and REMCs must have at least two negativepressure isolation rooms and three isolation rooms.
Gyeonggi Province, located in the western central part of the Korean Peninsula, borders the west coast and surrounds the capital city of Seoul. It covers an area of 10,188 km2 and has a population of 13.5 million as of 2020. Apart from the areas bordering the other provinces, the remaining areas were divided into four emergency medical regions: northeast, northwest, southeast, and southwest (Supplementary Fig. 1). Table 1 shows the emergency medical resources for each of the four emergency medical regions in Gyeonggi Province. The population of each region was highest in the southwest region at 4,003,388 and lowest in the northeast at 986,013. The number of ED beds per 100,000 population was highest in the northeast region in 2019 and 2020, at 13.6 and 14.0, respectively. The number of ED isolation rooms per million population was highest in 2019 in the northwest region at 10.3 and highest in 2020 in the southwest region at 12.2.

Emergency medical resources of the four emergency medical regions in Gyeonggi Province
The Korean EMS system, which is a government-operated system, provides basic-to-intermediate level ambulance services. Gyeonggi Province has the largest number of dispatches and transfers among the 119-service ambulances nationwide. A total of 263 ambulances were used, with 1,912 emergency medical technicians on active duty, including 1,145 level 1 emergency medical technicians and 589 nurses [13].
Data source
This study used the EMS run sheet database published by Gyeonggi Data Dream [14]. The numbers of EMCs and isolation rooms by region were obtained using the data from the emergency medical portal of the National Emergency Medical Center (NEMC) as of December 31, 2020.
Study population
All patients who used the 119 service in any of the four emergency medical regions in Gyeonggi Province during the study period were included. Cases lacking call time, dispatch time, scene arrival time, or return time were excluded.
Main outcome
The call-to-return time (elapsed interval from the time of 119 call to return to station) was the primary outcome. The call-to-return time and the call-to-scene time were calculated using call time, scene arrival time, and return time as recorded on the EMS ambulance run sheet.
Variables
The main exposures were the COVID-19 pandemic period and the number of ED isolation rooms in the region. The COVID-19 pandemic period was defined as any time after February 23, 2020. The total numbers of isolation rooms and beds in EMCs for each region were calculated by summing the number of quarantined rooms in the region reported to the NEMC. The numbers of isolation rooms and ED beds on December 31, 2019 were applied to the data from January 1, 2019 to December 31, 2019. The numbers of isolation rooms and ED beds on December 31, 2020 were applied to the data from January 1, 2020 to December 31, 2020. Scene distance was defined as that between the dispatch site and the scene. The emergency medical region was defined according to the city where the patient was when they called 119. Occurrence place was categorized into private residence, group living or healthcare facility, or other public place based on the information in the ambulance run sheet. Patient symptoms, particularly fever and respiratory symptoms, were defined according to the chief complaints listed on the ambulance run sheet. Respiratory symptoms included dyspnea, cough, sputum, sore throat, and hemoptysis. Patients who were reported to be less than “alert” on the AVPU (alert, voice, pain, unresponsive) scale were defined as mentally altered.
Statistical analyses
The differences before and after the COVID-19 pandemic period were compared using the chi-square test for categorical variables such as age group, sex, emergency medical region, out-of-area dispatch, foreigners, place, type of occurrence, symptoms, and altered mental status. Continuous variables such as age, scene distance, and time variables were described as medians and interquartile ranges, and the difference before and after the COVID-19 pandemic period was compared using the Wilcoxon rank-sum test.
To assess the effects of the COVID-19 period and regional ED isolation rooms on EMS travel time, two types of multivariable regression models were constructed. First, a generalized linear model (GLM) with a log link function and gamma distribution to fit skewed EMS travel times including call-to-return time and call-to-scene time was analyzed [15]. The exponential β coefficient [exp(β)] and 95% confidence interval for each effect variable were calculated in a univariable GLM. Multivariable GLMs with and without interaction terms were fit to estimate the effect of the COVID-19 period and the total number of isolation rooms in each region on the call-to-return time and call-toscene arrival time and to adjust for the effects of confounders, including age, sex, number of ED beds, scene distance, call month, foreign nationality, fever, respiratory symptom, altered mental state, and trauma. The estimated exp(β) for the number of isolation rooms per million population in each region in 2020 (northeast, 10.14; northwest, 11.72; southeast, 11.07; southwest, 12.24) was calculated. While the adjusted confounders were constant, the changes in call-to-return time during the COVID-19 period according to the number of isolation rooms per million population in 2020 in each region (northeast, 10.14; northwest, 11.72; southeast, 11.07; southwest, 12.24) are shown in an interaction plot using the EFFECTPLOT statement in SAS ver. 9.4 (SAS Institute Inc.).
Second, a logistic regression model was analyzed to dichotomize cutoff values for call-to-return time (longer than 2 hours). Univariable and multivariable logistic regression models with an interaction term were fit to estimate the effect of COVID-19 according to the total number of isolation rooms in each region on the delayed call-to-return time. Confounders, including age, sex, number of ED beds, scene distance, call month, foreign nationality, fever, respiratory symptom, altered mental status, and trauma were adjusted. All statistical analyses were conducted using SAS ver. 9.4.
RESULTS
Of the 929,044 EMS-assessed cases during the study period, 781,246 were included in the analysis after excluding cases with missing time variables (Fig. 1). Table 2 summarizes the demographic characteristics of the EMS-assessed patients before and after the COVID-19 pandemic. Before the pandemic started on February 23, 2020, there were a total of 463,570 cases, with a daily average of 1,109.0 cases. The number of cases during the pandemic was 317,676 with a daily average of 1,014.9 cases. In both periods, the median age was 56 years, and the male proportion was 49.3% before the pandemic and 49.9% during the pandemic. There was no significant difference in the case volume by region before and after the pandemic. Among the main symptoms, fever (before 4.0% vs. after 4.5%, P<0.05) and respiratory symptoms (before 3.7% vs. after 4.4%, P<0.05) increased significantly during the pandemic. The call-to-departure time was 2 minutes in both periods. During the pandemic, the call-to-scene time (before 8 minutes vs. after 9 minutes, P<0.05) and call-to-return time (before 46 minutes vs. after 52 minutes, P<0.05) for emergency patients increased significantly.
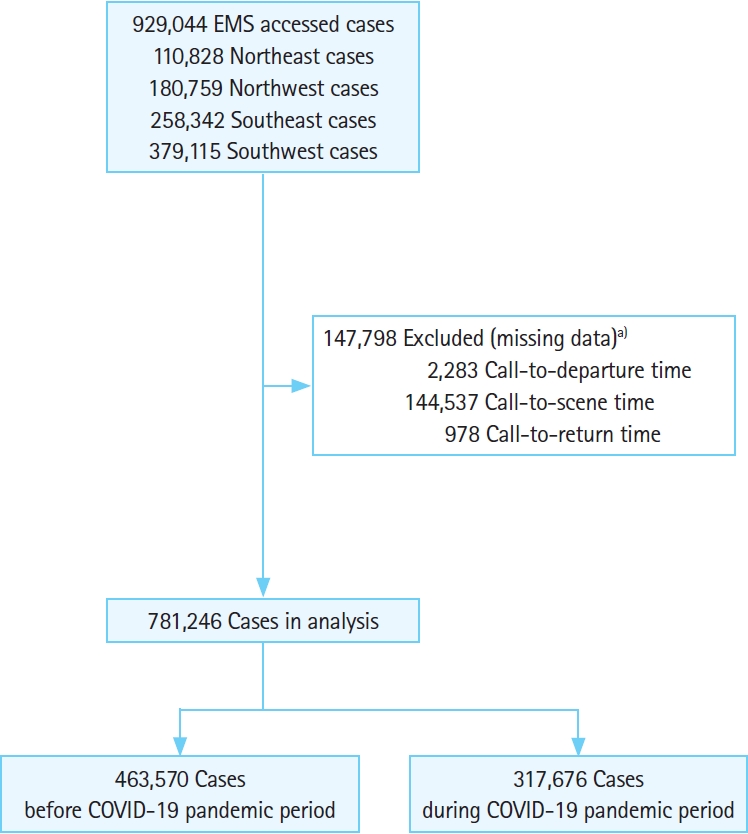
Flowchart of patient inclusion. EMS, emergency medical service. a)15,271 Northeast cases (13.8%), 25,777 northwest cases (14.3%), 43,742 southeast cases (16.9%), and 63,008 southwest cases (16.6%).
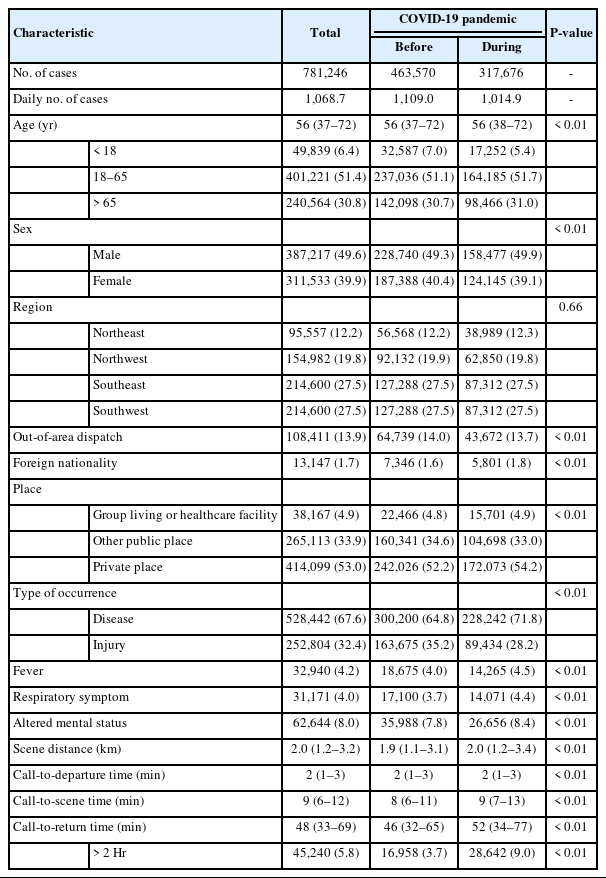
Baseline characteristics of study populations
Table 3 shows the change in EMS travel time during the pandemic. In all four regions, call-to-departure time, call-to-scene time, and call-to-return time increased significantly compared with before the pandemic (P<0.05). During the COVID-19 pandemic, the median call-to-return time increased continuously, and the number of COVID-19 patients also increased continuously (Supplementary Fig. 2).
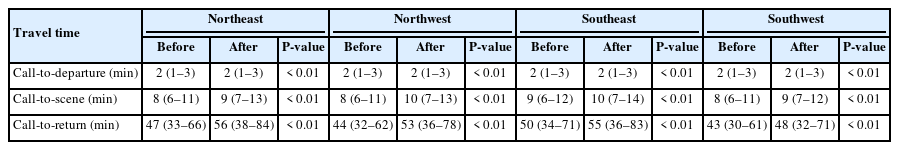
Emergency medical service travel time according to the period of COVID-19 by regions
Table 4 shows the effect of each variable on the delay in EMS call-to-return time in the univariable GLM. During the pandemic, the call-to-return time increased by 1.18 times compared to that before the pandemic (P<0.05). For each increase in the number of isolation rooms in the region per million population, the call-to-return time increased by 1.03 times. It was also observed that fever, respiratory symptoms, and altered mental status increased the call-to-return time by 1.42, 1.44, and 1.21 times, respectively.

Effect of each variable on call-to-return time in the univariable generalized linear model
Table 5 shows the association between the pandemic and regional isolation rooms for the call-to-return time in a multivariable GLM. The number of regional isolation rooms had a statistically significant interaction effect with the COVID-19 period (P<0.05). As regional isolation rooms increased, the effect of COVID-19 on the call-to-return time decreased significantly in the multivariable GLM with interaction term (10.14 isolation rooms per million population: adjusted exp(β), 1.33; 12.24 isolation rooms per million population: adjusted exp(β), 1.18). The interaction plot in Fig. 2 shows that the delay in the call-to-return time during the pandemic was greater in regions with fewer isolation rooms. Supplementary Table 1 shows the association between the pandemic and the number of regional isolation rooms for call-to-scene time. As the number of regional isolation rooms increased, the effect of COVID-19 on the call-to-scene time decreased significantly in a multivariable GLM with an interaction term (10.14 isolation rooms per million population: adjusted exp(β), 1.20; 12.24 isolation rooms per million population: adjusted exp(β), 1.09). The interaction plot in Supplementary Fig. 3 shows that the delay in the call-to-scene time during the pandemic was greater in regions with fewer isolation rooms.
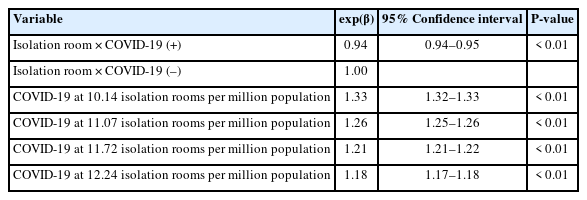
Effect of COVID-19 period on call-to-return time in generalized linear model with interaction analysis of regional isolation room

Interaction plot of the COVID-19 period and the number of isolation rooms per million population on call-to-return time. Fit computed: number of emergency department beds, 10.69; scene distance, 2.60 km; call month, 6.35; age group, >65 years; male sex; fever; altered mental status; respiratory symptom; trauma; occurred at other public place; foreign nationality.
Table 6 shows the interaction effect between COVID-19 and region isolation rooms for delayed call-to-return time more than 2 hours. In the unadjusted logistic regression, the COVID-19 period increased the delayed call-to-return time by 2.67 times (odds ratio [OR], 2.67; P<0.05). COVID-19 had a significant interaction with the number of isolation rooms (P<0.05), and the effect of COVID-19 significantly decreased as isolation room number increased (10.14 isolation rooms per million population: OR 2.07, P<0.05; 12.24 isolation rooms per million population: OR 1.58, P<0.05).
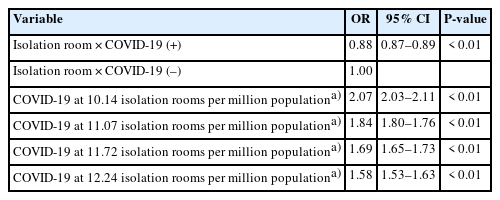
Effect of regional isolation room and COVID-19 period on more than 2-hour call-to-return time with interaction analysis of regional isolation room
DISCUSSION
This study was conducted to analyze the effect of imbalance in the distribution of emergency medical resources between regions in the prehospital stage for people seeking emergency services during the COVID-19 pandemic. The call-to-return time and the call-to-scene time of emergency patients increased significantly overall during the pandemic. However, as the number of isolation beds in emergency rooms in regions increased, both the call-to-return time and the call-to-scene time showed a smaller increase during the pandemic.
Previous studies have reported an increase in the time required to visit the emergency room during COVID-19 [4,16], and consequently, patient prognoses for various diseases deteriorated [5,16–21]. Further, delayed patient arrival time to the hospital worsened prognosis for diseases such as stroke, myocardial infarction, and cardiac arrest [22–25]. In this study, we observed that the EMS call-to-return time significantly increased during the pandemic in Gyeonggi Province. The call-to-hospital-arrival time was not available, and it was not possible to determine whether the patient was directly delayed in transport. However, it could be estimated that the call-to-hospital arrival time increased as the call-to-departure time and the call-to-return time increased. According to previous studies, uneven distribution of emergency resources between regions affected patient prognosis [26–28]. This study shows that when the number of isolation rooms in a region is low, the call-to-return time increases during an infectious state of emergency.
Fever and respiratory symptoms are typical presentations of COVID-19 [11]. This study showed that the call-to-return time is significantly delayed for patients with fever or respiratory symptoms (Table 4). Not only the symptoms associated with COVID-19, but also the occurrence location and patient nationality were significantly associated with delayed call-to-return time (Table 4). Cluster infections of COVID-19 have occurred in group living facilities like nursing homes and long-term care facilities [29]. Korea took measures to prevent COVID-19-infected people from entering the country since the beginning of the COVID-19 pandemic. This suggests that patient with suspected COVID-19 infection are more vulnerable to EMS access during the COVID-19 pandemic.
In this study, when the number of isolation rooms per million population was 10.14, the adjusted exp(βs) of COVID-19 was 1.33, and when the number of isolation rooms per million population was 12.24, the adjusted exp(β) was 1.18. Therefore, the increase in call-to-return time during the pandemic was reduced by 7.1% with an increase of one isolation room per million population. After the outbreak of the Middle Eastern respiratory syndrome (MERS) coronavirus, an infectious disease disaster that occurred in Korea in 2015, the minimum number of isolation rooms needed in an emergency room was determined by the EMC level. According to the Emergency Medical Service Act, an LEMC must operate at least two isolation rooms. The Enforcement Decree of the Emergency Medical Service Act also mandates that the LEMC should provide one isolation bed per 500,000 people in each province. Thus, the difference of one isolation room per million population is estimated to be the effect size of 0.5 LEMC per million population; the added effect can be estimated as operation of 25% more LEMC compared with operation of the existing two LEMCs.
As shown in Table 1, the number of isolation beds per million population and the number of beds in emergency rooms per 100,000 population differ by region. In particular, the northeast region has the highest number of emergency beds but the lowest number of isolation rooms per capita. In Fig. 2, the call-to-return time and the call-to-scene time show the largest increase in this region during the COVID-19 pandemic. The difference between the number of ED beds versus isolation beds per population in the region is due to the lack of higher tier EMCs. The proportion of high-tier EMCs, more than LMCs, largely varies between regions (southeast, 58%; northeast, 25%; southwest, 61%; northwest, 78%). Lee [30] also noted an imbalance in the supply and demand of EMS when analyzing the spatial gap in Seoul, Korea. According to Yoo [31], most medical institutions in Korea are private and concentrated in urban areas. Therefore, there were relatively fewer high-tier EMCs in rural areas. Consequently, there was a lack of emergency medical resources such as isolation rooms. Thus, rural areas were more vulnerable to medical disasters like COVID-19. Therefore, it is necessary to reduce the imbalance of emergency medical resources between regions through investment in public hospitals.
This study had several limitations. First, it was conducted in a province in Korea, Gyeonggi Province, and the response protocol for COVID-19 was conducted differently depending on the available resources in each country and region, so it is difficult to generalize the results of this study. Second, the primary outcome of this study was call-to-return time, and it is difficult to estimate the actual patient’s prehospital time because the call-tohospital arrival time was omitted in this study. Therefore, there is a limitation to interpreting the results of this study as a prehospital time delay for patients during the COVID-19 pandemic. This study tried to interpret the primary outcome by focusing on the burden of the EMS to transport each patient. To analyze the effect of the number of isolation rooms on delay of initial medical access, the call-to-scene time was presented as a secondary outcome. Third, dynamic changes in health and medical policies of the government including social distancing during the pandemic and the change in the number of isolation rooms were not considered due to lack of data. By applying the annual number of isolation rooms and the number of ED beds, the difference between before and after COVID-19 was applied to the model to evaluate the regional response to COVID-19. Therefore, because the number of isolation rooms was calculated to have increased even in January and February 2020, before the pandemic, caution is needed when interpretating this study. Fourth, the differences between the regions were simplified by the number of isolation room and ED beds. The difference in medical accessibility according to geographic factors between regions was corrected using event-scene distance. However, it was not possible to precisely correct the differences in the distribution of emergency medical resources such as the EMS call volume and EMC tier between regions. However, according to the Korea Emergency Medical Act, the number of isolation beds in a region is determined by the EMC tier. Thus, this study reflected the difference in response to COVID-19 according to the level of emergency medical institutions in the region. Fifth, delayed EMS travel time was defined as an arbitrary criterion. The number of cases of delayed call-to-return time over 2 hours increased, but this does not provide additional information other than that average EMS travel time was delayed.
During the COVID-19 pandemic, the call-to-return time and call-to-scene time for emergency patients significantly increased. The greater was the number of isolation rooms among emergency rooms in a region, the smaller were the increases in call-to-scene time and call-to-return time. The lack of regional isolation rooms was associated with a delay in transfer during the prehospital stage and an increased burden for EMS.
SUPPLEMENTARY MATERIAL
Supplementary material is available at https://doi.org/10.15441/ceem.22.355.
Supplementary Table 1.
Effect of COVID-19 period on call-to-scene time in generalized linear model with interaction analysis of regional isolation room
Supplementary Fig. 1.
Emergency medical region map of Gyeonggi Province.
Supplementary Fig. 2.
Daily call-to-return time according to regions and COVID-19 patients in Gyeonggi Province.
Supplementary Fig. 3.
Interaction plot of COVID-19 period and isolation room on call-to-scene time.
Notes
CONFLICT OF INTEREST
No potential conflict of interest relevant to this article was reported.
FUNDING
None.
AUTHOR CONTRIBUTIONS
Conceptualization: DSC; Data curation: SIL; Formal analysis: SIL; Investigation: SBK, DSC; Methodology: SYL; Project administration: DSC; Resources: SYL; Software: SYL; Supervision: DSC; Validation: DSC; Visualization: DSC; Writing–original draft: SIL, SBK; Writing–review & editing: SYL, DSC. All authors read and approved the final manuscript.
Acknowledgements
The authors thank the Gyeonggi Data Center and the National Emergency Medical Center (NEMC) for the database access.
References
Article information Continued
Notes
Capsule Summary
What is already known
Isolation beds within the region are unevenly distributed by region, and quarantine beds are an essential medical resource for treating suspected COVID-19 patients.
What is new in the current study
Emergency medical service travel time was longer during the COVID-19 pandemic in regions with fewer isolated beds in emergency rooms.