Relationships between trauma death, disability, and geographic factors: a systematic review
Article information

Abstract
Objective
Trauma is a global health problem. The causes of trauma-related deaths are diverse and may depend in part on socioeconomic and geographical factors; however, there have been few studies addressing such relationships. The aim of this study was to investigate the relationships between trauma and geographical factors in order to support policy recommendations to reduce trauma-related deaths and disability.
Methods
In accordance with the PRISMA (Preferred Reporting Items for Systematic Reviews and Meta-Analyses) guidelines, we searched international and Korean databases to retrieve relevant literature published between 2000 and 2020.
Results
Thirty-two studies showed a positive relationship between the outcomes of major trauma and geographical factors. The study investigated regional factors including economic factors such as size of urban areas, gross domestic product, and poverty rate, as well as hospital parameters, such as presence of trauma centers and number of hospital beds. There was a tendency toward higher mortality rates in rural and low-income areas, and most of the studies reported that the presence of trauma centers reduced trauma-related mortality rates.
Conclusion
Our study showed that geographic factors influence trauma outcomes. The findings suggest geographical considerations be included in care plans to reduce death and disability caused by trauma.
INTRODUCTION
Trauma is a global health problem [1], causing a reported 58 million global deaths every year, which represents about 10% of all deaths [2]. Since trauma was recognized as a critical cause of death and disability in patients, multiple studies of trauma-related mortality and disability have been published [3]. According to an annual report summarizing the causes of death published by Statistics Korea, 304,948 Koreans died from trauma in 2020. Among these, 26,442 (8.7%) died of external causes such as suicide, traffic accidents, and falls [4]. When expressed as incidence per 100,000 people, 25.7 died from suicide, 7.7 from traffic accidents, and 5.2 from falls. Worldwide, trauma is one of the leading causes of death, especially in the working age group (15 to 44 years), with many of the fatalities resulting from traffic accidents and self-harm. Socioeconomic losses due to trauma account for 60% to 62% of the total socioeconomic costs, indicating trauma to be associated with a high socioeconomic burden [5].
In the past, trauma was perceived to be a greater issue among low-income people with poor medical access. The US Department of Health and Human Service Centers for Disease Control and Prevention reported that deaths from trauma are not only a matter of concern in low-income counties, but also in high-income countries [6]. Today, it is believed that trauma can happen to anyone but is often preventable: as such, there are ongoing efforts to reduce trauma cases [1] that include measurement of preventable trauma death rates. Preventable traumatic deaths are defined as trauma-related deaths that would have been avoided if trauma patients had received clinically “correct” diagnoses and optimal medical care [7]. There is a large body of research related to preventable traumatic death rates in Korea [7–10], reporting rates of 40.5%, 39.6%, and 39.6% of trauma-related deaths in 1997−1998, 2003−2004, and 2009−2010, respectively. Researchers have predicted that if the medical infrastructure in Korea was equivalent to that of advanced nations, the preventable death rates would fall to less than 20% [8–11]. However, the preventable death rates may vary by region within a given country. Even if a country has well-established trauma care systems and improves medical quality at a national level, the quality and quantity of care may vary between regions, especially with respect to prehospital and in-hospital systems, medical resources, and level of medical centers [7,12]. The accessibility of medical services and service quality may significantly affect an individual’s health [13]. The causes of trauma-related deaths may also vary regionally due to socioeconomic and geographical factors [3,14]. Many advanced nations have reported such a correlation between geographical factors and incidence of trauma [15,16]. There have been few Korean studies addressing the socioeconomic and geographical factors that influence trauma since most domestic studies have focused on trauma patterns, pattern analyses, and clinical outcomes related to trauma in certain body parts [17].
Based on the background above, the aim of the study was to investigate the relationships between trauma and geographical factors in order to support policies to reduce trauma-related deaths and disability. We performed a systematic review of published studies.
METHODS
The PRISMA (Preferred Reporting Items for Systematic Reviews and Meta-Analysis) guidelines were used for this study [18]. To ensure objectivity, two researchers independently reviewed the retrieved articles based on the PRISMA flowchart. The two researchers reached a consensus through discussions when they disagreed with the assessment. A risk-of-bias assessment was conducted for the articles included in the final set of references.
Reference literature
The research was conducted with literature published in Korean databases and several international databases from January 1, 2000 to December 31, 2020: RISS (Research Information Sharing Service), KISS (Korean Studies Information Service System), KMbase (Korean Medical Database), KoreaMed, KNbase (Korean Nursing Database), National Assembly Library of Korea, PubMed, MEDLINE (via Ovid), Cochrane Library, ClinicalKey, CINAHL (Cumulative Index to Nursing and Allied Health Literature), and EBSCOhost, with the last date of search June 27, 2021.
Databases were selected based on systematic literature reviews. The search terms (both in Korean and English) were as follows: (1) “urbanization” AND “trauma” AND “outcome” OR “injury and wounds” AND “outcome” OR “trauma” AND “Glasgow Outcome Scale (GOS)” OR “injury and wound“ AND “GOS”; (2) “geographic” AND “trauma” AND “outcome” OR “injury and wounds” AND “outcome” OR “trauma” AND “GOS” OR “injury and wound” AND “GOS”; (3) “community” AND “trauma” AND “outcome” OR “injury and wounds” AND “outcome” OR “trauma” AND “GOS” OR “injury and wound” AND “GOS.”
Literature selection
The selection of publications for inclusion was conducted in two phases. In the first phase, the researchers reviewed the title and abstract of each of the initially selected articles and then excluded case studies and papers that did not consider geographic and sociodemographic factors. In the second phase, the articles selected in the first phase were reassessed based on the following factors: (1) whether dependent variables were related to trauma patients; (2) whether geographic factors were considered independent variables and if the study clarified, what causes influenced the patient’s diagnosis of trauma; (3) whether the papers were published in an academic journal and analyzed correlations between trauma and regional factors; and (4) whether the papers met the purpose of this study.
Risk-of-bias assessment
A risk-of-bias assessment was conducted for the 32 studies selected for inclusion. The risk-of-bias assessment may also be called a quality assessment or critical appraisal of the included studies. The risk-of-bias assessment is needed to avoid any wrong conclusion due to heterogeneity, publication bias, etc. during a systematic literature review [19]. We used a checklist (QualSyst) developed by the Alberta Heritage Foundation for Medical Research to assess the risk of bias in the included quantitative studies. QualSyst is a verified systematic review tool and very practical and useful for various study designs [20,21]. The QualSyst checklist includes 14 items, but only 11 were used for this study [22].
RESULTS
Literature selection and risk-of-bias assessment
A total of 170,425 articles was searched, of which 81,264 were selected after excluding duplicate publications. After the first phase of selection, 141 articles remained. Of the 141 articles, 109 were excluded based on the criteria for the second phase of literature selection. The reasons for exclusion were as follows: (1) 12 articles dealt with dependent variables but were not related to trauma; (2) 86 articles did not consider geographical variables; (3) five articles did not assess the outcomes of trauma; and (4) six articles did not meet the purpose of this study. If an article failed for more than two reasons, the first factor we considered was whether the outcome was due to injury (in order of (1), (2) and (3)). Finally, we reviewed the remaining 32 articles published from January 1, 2010 to December 31, 2020 (Fig. 1).
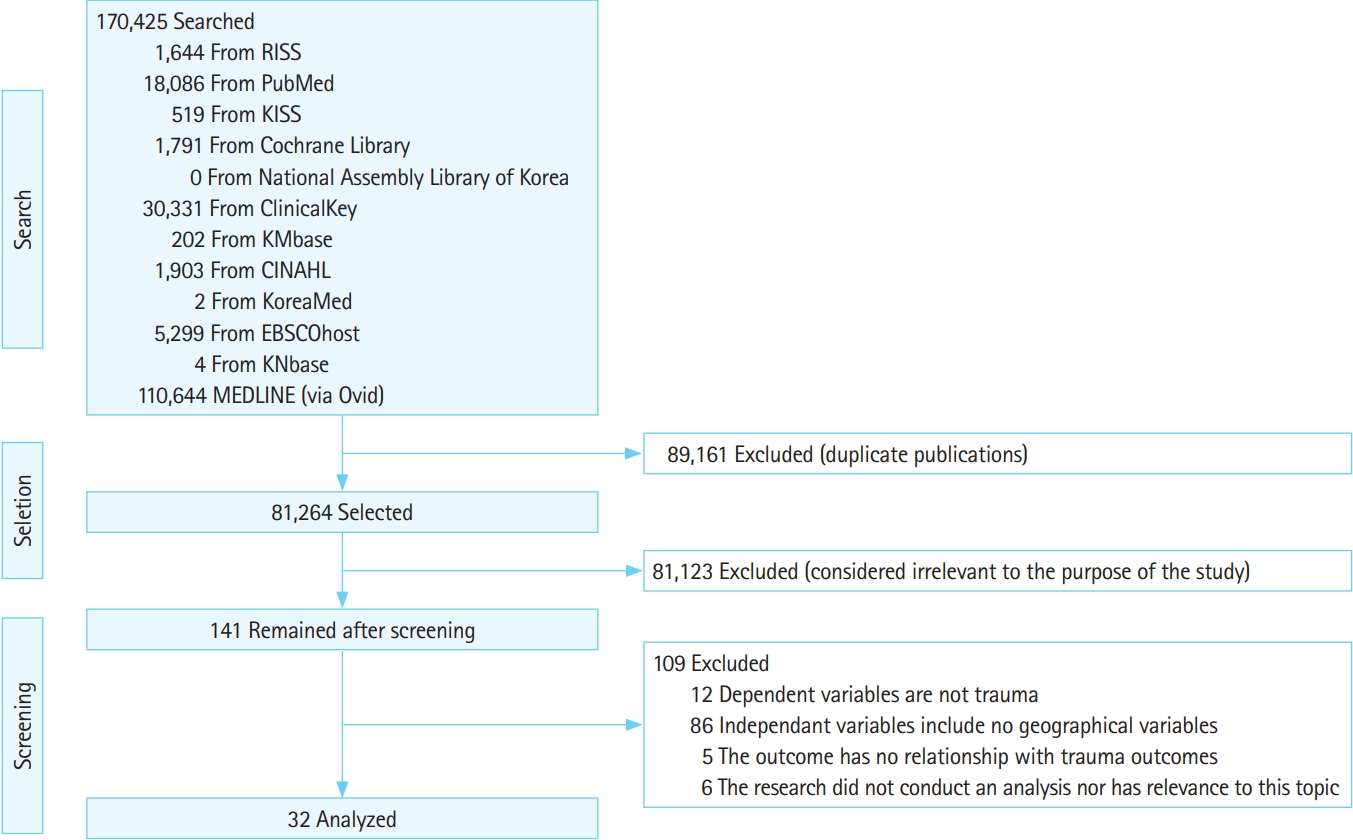
Study flowchart. RISS, Research Information Sharing Service; KISS, Korean Studies Information Service System; KMbase, Korean Medical Database; KNbase, Korean Nursing Database; CINAHL, Cumulative Index to Nursing and Allied Health Literature.
We assessed risk of bias in the 32 studies based on the 11 items of the QualSyst checklist and scored them 0 (no), 1 (partial), or 2 (yes). The two reviewers assessed the 32 studies and compared the results. When disagreements occurred, consensus was reached through discussions involving a third author (Table 1).

QualSyst (Alberta Heritage Foundation for Medical Research) for quality assessment in the study (n=32)
QualSyst recommends exclusion of articles that do not meet the minimum threshold of 0.55 from a systematic review [23]. Some articles did not meet some criteria, but they were also reviewed since the total score of each of them was more than 0.99 (Supplementary Table 1) [16,24–54].
Structure of the study
We found that 27 of the 32 studies (84.4%) [16,24,25,28–31,34,35,37–54] were published after 2010, indicating that geographic factors influencing major trauma have recently become a priority for study. Of the 32 studies, 18 studies [16,24,25,27,29,30,32,39–43,45,47–50,52] selected study subjects of all ages, eight studies [26,34,35,38,44,46,51,53] were adults, one [54] studied people in their 50s or older, and five [28,31,33,36,37] studied children and adolescents.
Data sources and methods of analysis
Table 2 summarizes the general characteristics of the 32 studies [16,24–54]. Of the 32 studies, one [26] used data obtained from insurance companies, while all other used representative regional and national data; specifically, nine [16,31,34,40–42,46,48,51] used national data and one [32] used cross-national data, and the remainder [24–30,33,35–39,43–45,47,49,50,52–54] used regional data. Of the 32 articles, there was one systematic review [38] and one scoping review [25]. Nineteen studies (63.3%) [16,24,26,28,30,31,36,37,40,41,43–50,52] used data from the United States, four studies (13.3%) [34,39,42,51] from Asia, three studies (10.0%) [29,33,53] from Oceania, three studies (10.0%) [32,35,54] from Europe, and one study (3.3%) [27] from Africa.
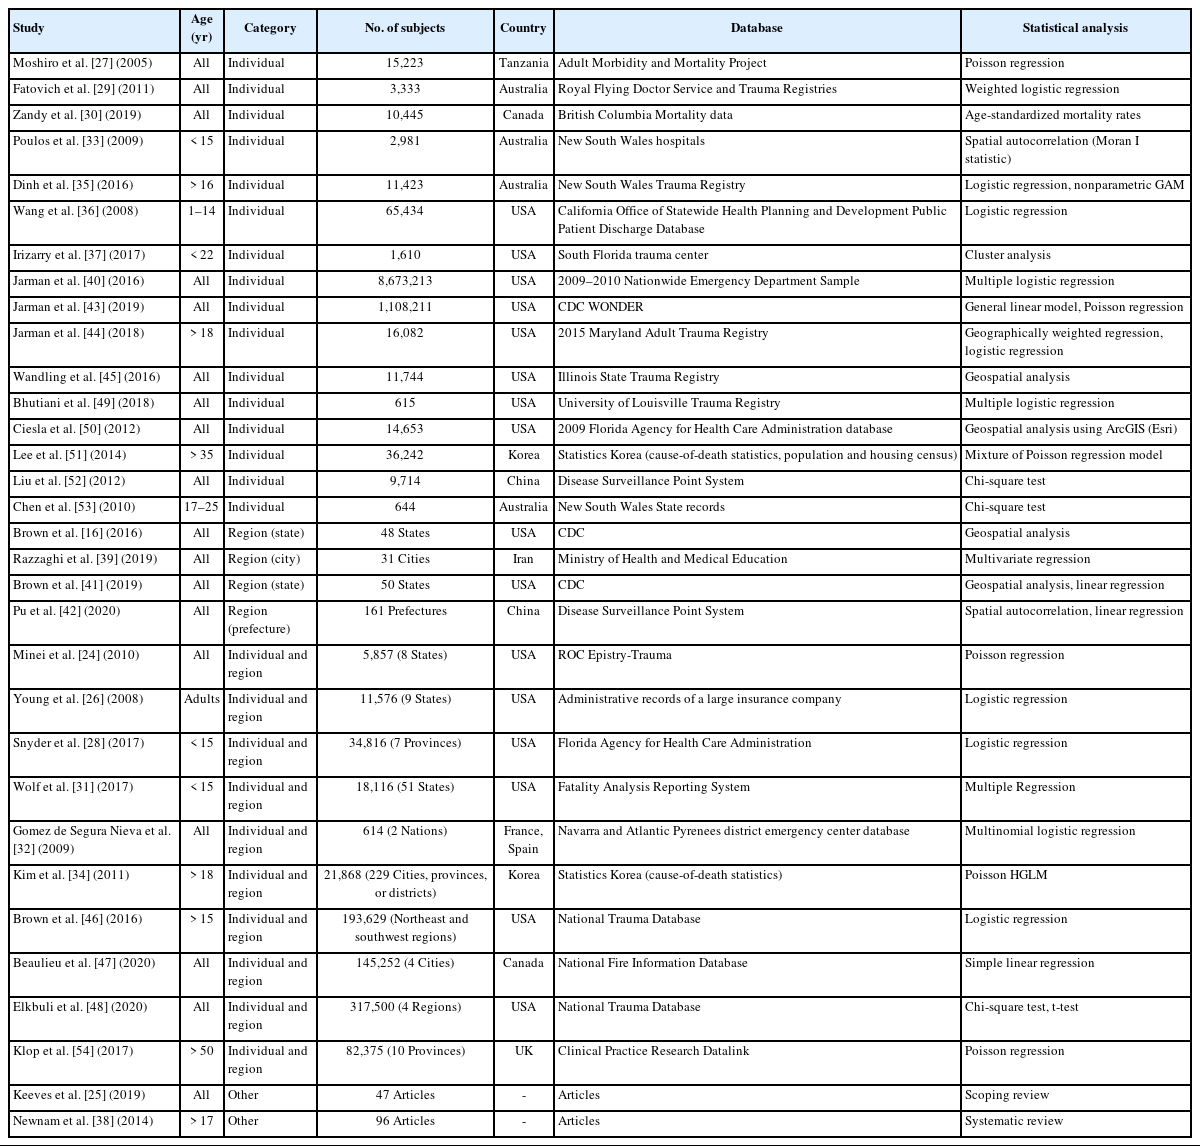
General characteristics of cited studies
The studies were assigned to one of five categories for assessment: 16 [27,29,30,33,35–37,40,43–45,49–53] in individual, four [16,39,41,42] in regional, 10 [24,26,28,31,32,34,46–48,54] in individual and regional, one [38] in systematic review, and one [25] in scoping review. The sample population sizes ranged from 614 to 8,673,213 subjects. Among the 32 articles, 23 [24,26–31,33–37,40,43–48,50–52,54] analyzed more than 1,000 subjects.
While some of the 32 studies used more than one data analysis method, the main method in six studies [24,27,34,43,51,54] was Poisson regression, 10 [26,28,29,32,35,36,40,44,46,49] used logistic regression, three [48,52,53] used chi-square test, and five [16,41,42,45,50] used geospatial analytics. The remaining studies [25,30,31,33,37–39,47] used other methods such as multivariate or multiple regression.
Geographic factors as independent variables and use of dependent variables
To classify the papers, we conducted two rounds of categorization: one considering the possibility of multiple category duplication and another with the aim of avoiding duplication. To avoid duplication, three authors discussed and selected the important variables and classified them into the corresponding categories geographic factors as independent variables were divided into three categories. First, we classified the studies focusing on the connections between social structures and geographic factors as “socioeconomic.” Second, we categorized the studies focusing on medical resources as “medical-resource–related.” Finally, we categorized the studies focusing on environments where trauma is likely to occur as “environmental.” The results of the analyses showed that, with the exception of systematic and scoping review articles, five studies [30,37,39,44,51] were classified as socioeconomic, six [16,36,45,46,48,50] as medical-resource–related, and 19 [24,26–29,31–35,40–43,47,49,52–54] as environmental (Table 3).

Category and details of independent variables of 30 studies
In another round where we considered the possibility of duplication (Table 4) [16,24,26–37,39–54], we divided the socioeconomic category into three subcategories: geodemographic, economic, and individual. Five studies [24,39,41,47,49] analyzed geodemographic factors such as population density; seven [34,39,42, 43,46,51,53] analyzed economic factors such as gross domestic product, resident tax, house income, type of insurance, middle-class household income, poverty rate, and unemployment rate; and 11 [16,30,33,36,37,44,45,49,51,53,54] analyzed individual factors such as race, level of education, and per capita income.

Detail of categorization for independent variables and their use of 30 studies
The medical-resource–related category was divided into two subcategories: prehospital and in-hospital. Six [24,32,35,44–46] addressed prehospital factors such as distance from the site to a trauma center, time from scene to medical institution, type of transfer vehicle, and the numbers of helicopters and helipads; while 12 [16,28,32,35,36,40,43–46,48,50] analyzed in-hospital factors such as presence of a trauma center, level of trauma center, and number of beds.
The environmental category was also divided into three subcategories: road environment, geospatial factors, and legal factors. Among the 27 studies, one [39] addressed road characteristics of speed limit, type of road, road conditions, and roadway congestion index; 14 [26,27,29,33–35,40–44,52–54] analyzed geospatial factors such as urbanization and area of the city, and one [31] addressed legal factors such as regulations on seat belts and safety seats, red-light and speed-camera policies, speed limits, and laws applicable to driving under the influence.
Outcomes of trauma
We found that six types of dependent variable (mortality, disability, severity, survival and discharge, death and impairment, and work disability) were used in the 32 studies included in the analyses. Among the 32 studies, 22 [16,25,28–31,34,35,37,39–45,48,49,51–54] identified incidences of death and survival rate as dependent variables, and the rest used disability rate [27], death and impairment rate [28,38,47], severity of trauma [32,36], survival and discharge rates [24,33,46,50], and work disability rates [26]. Dependent variables were identified through medical records in 28 studies (91%) [16,24,28–37,39–54], through a survey in one study (3%) [27], through a large insurance company in one study (3%) [26], and the remaining two studies were a systematic literature review [38] and a scoping review [25].
More specifically, Wang et al. [36] referred to medical records to obtain trauma severity scores. Brown et al. [46] analyzed survival and discharge rates obtained from medical records. Moshiro et al. [27] used duration of impairment as reported through a survey. Young et al. [26] identified work disability through insurance records. Finally, Newnam et al. [38] conducted a systematic review for analyzing death and impairment. The above findings indicate that medical records are being widely used to assess the causes of major trauma (Table 5).

Dependent variables and data source used for the 32 studies
Correlations between outcomes of major trauma and geographic factors
We investigated the correlations between the outcomes and geographic factors and divided the subjects into four groups: all ages, adults, children, and middle-aged to elderly (Table 6). After excluding systematic and scoping review articles, the remaining 30 studies [16,24,26–37,39–54] showed a positive relationship between the outcomes of major trauma and geographic factors. The 19 studies [24,26–29,31–35,40–43,47,49,52–54] analyzing environmental factors also showed such positive relationships, as did five studies [30,37,39,44,51] analyzing socioeconomic factors and six studies [16,36,45,46,48,50] assessing medical resource factors.
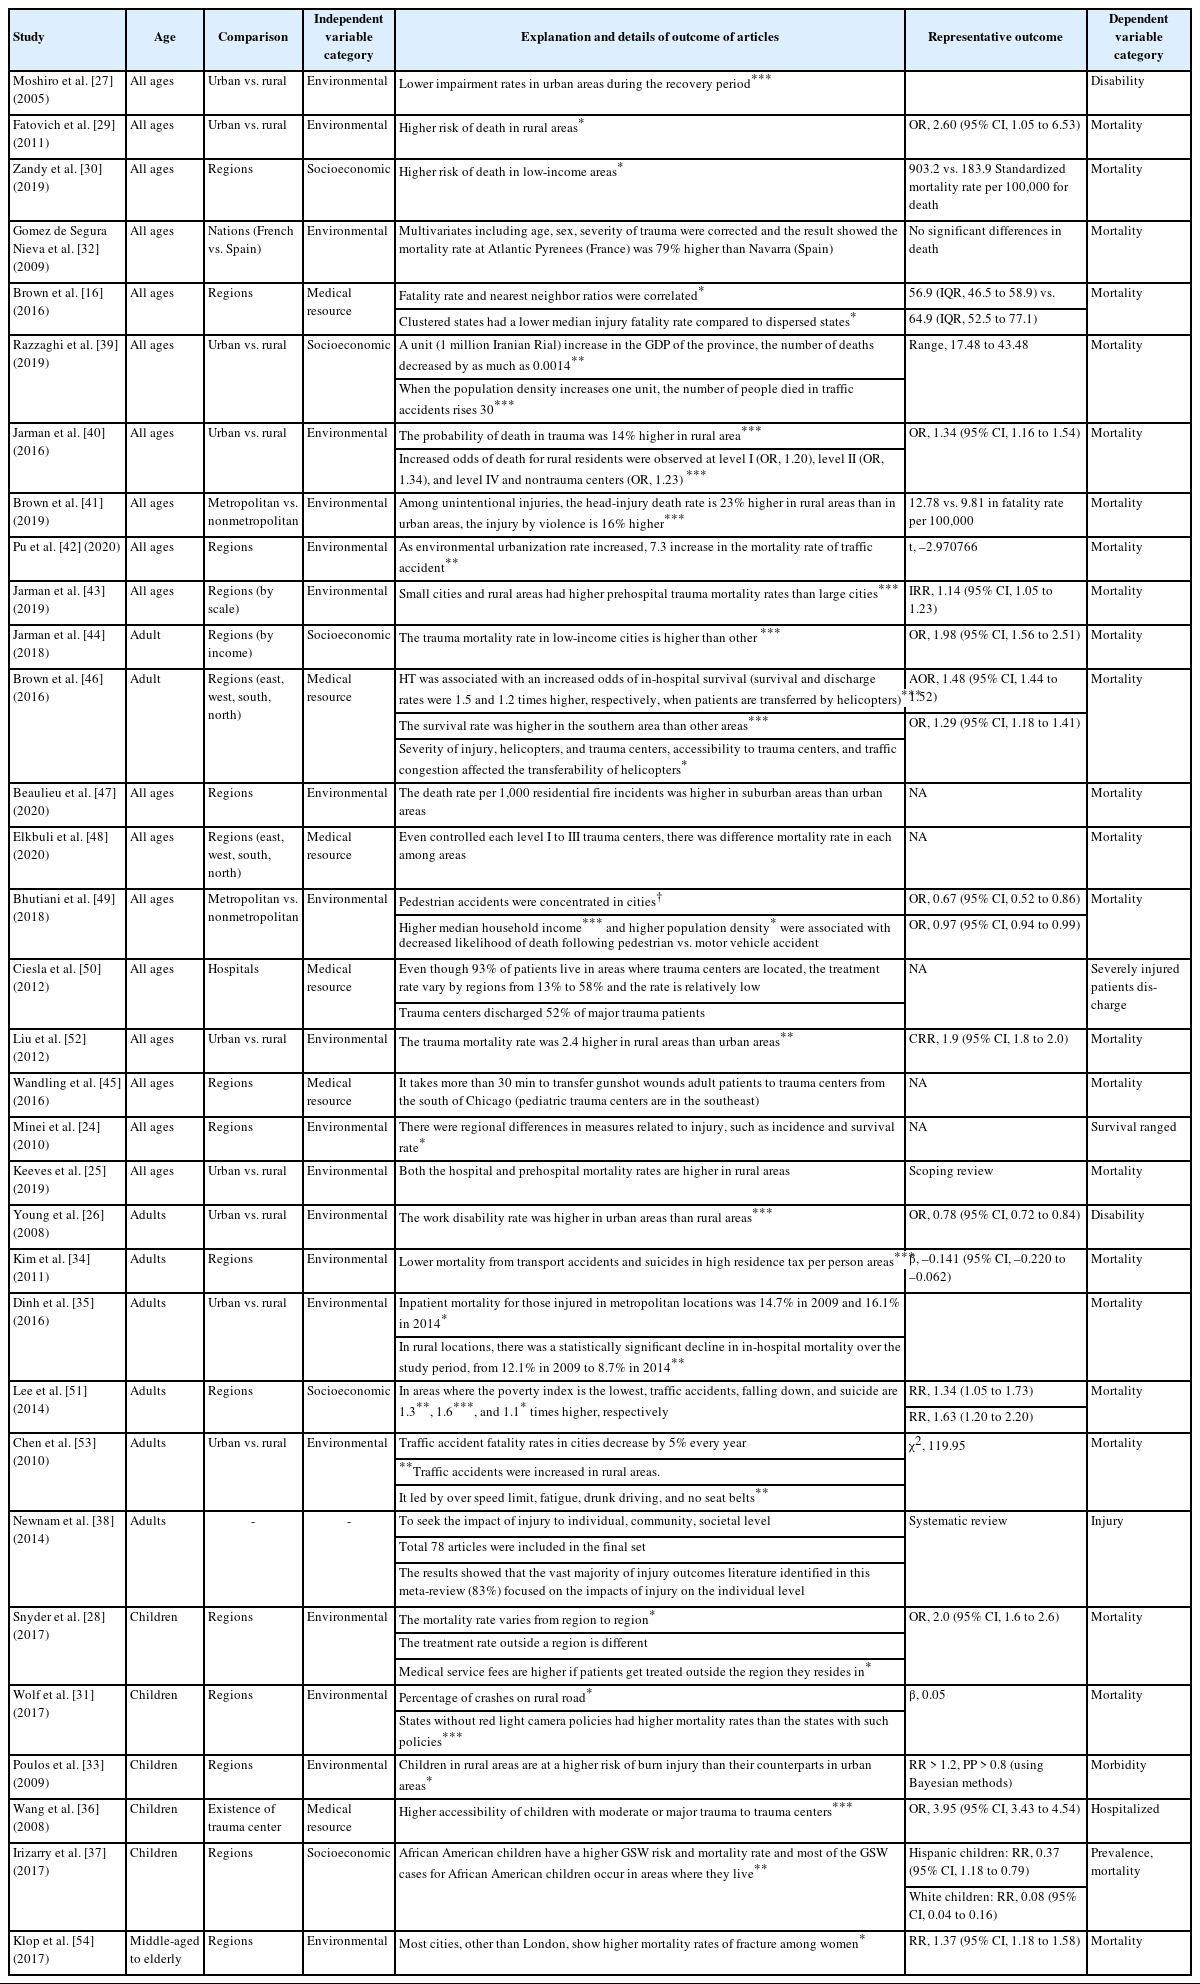
Geographical impact on the outcomes of trauma
Among the studies that examined factors affecting all age groups, environmental factors (12 studies [24,25,27,29,32,40–43,47,49,52]), socioeconomic factors (two studies [30,39]), and medical resources (four studies [16,45,48,50]) were the main variables identified. Studies that compared trauma outcomes in rural or urban environments showed that rural areas had higher mortality rates than urban areas, and studies that compared regional economic status found that low-income regions had higher mortality rates than high-income regions [29,39,51]. Bhutiani et al. [49] reported that traffic fatality rates increased as population density decreased.
With regard to medical resource factors, the better was accessibility to trauma centers, the lower were the death rates. Both death and disability rates are lower if patients can be transferred to hospitals with helicopters.
Five studies [26,34,35,51,53] focused on geographic factors affecting adult major trauma. Of these, four [26,34,35,53] addressed environmental factors, while one [51] addressed socioeconomic factors. In the four articles, three [26,34,53] showed higher mortality rates in rural area than in urban ones but an opposite result in impairment rate, with Dinh et al. [35] reporting opposite result regarding death. The articles analyzing socioeconomic factors showed higher incidence rates of trauma in low-income regions.
Among the five studies focusing on geographic factors influencing pediatric trauma, three [28,31,33] analyzed environmental factors, one [37] analyzed socioeconomic factors, and one [36] analyzed medical resource factors. The three articles assessing environmental factors showed that the risk of pediatric trauma was greater in rural areas and mortality was greater in regions where safety regulations were not established. One article [54] analyzed the outcomes of major geriatric trauma and showed that the female mortality rate increased in all regions except the capital.
Although the findings of the 32 studies [16,24–54] varied depending on factors such as region, accessibility to trauma centers, injury severity, and traffic congestion, they generally indicated that trauma outcomes differed according to the characteristic of the area in which the patients lived. For example, pedestrian fatality rates tended to be lower in high-income areas [49]. Also, trauma death rates were greater in low-income areas than other areas [44,49]. Additionally, the mortality rates for injuries and head trauma were greater in rural areas than in urban areas, and prehospital trauma mortality was higher in both urban and rural areas than in metropolises [25,41,43].
DISCUSSION
This study used a systematic literature review to retrieve articles published in Korea and foreign countries that analyzed the correlations between disability or death in major trauma and geographical factors. The purpose of this study was to establish and strengthen policies on major trauma.
In this study, medical resources, including emergency medical systems and trauma care, were critical regional factors that need to be well-established to ensure timely and effective medical care. Having a well-established emergency medical system, as well as adequate trauma care facilities and sufficient beds and personnel, can significantly impact outcomes of emergency situations and foster prompt and effective care for patients with severe injuries. Therefore, ensuring adequate medical resources is crucial for the well-being of a region’s population. Studies in the United States have shown that, after improving the emergency medical system, the preventable death rate was reduced [55–57]. To that end, it is necessary for people to perceive trauma as a regional or national matter rather than an individual matter. When assigning emergency medical resources, few studies have recommended considering regional characteristics to decrease mortality due to major trauma and to establish integrated trauma care systems from injury to discharge [58,59].
In previous studies, it has been suggested that in order to reduce the disparities in mortality rates that are attributed to socioeconomic factors such as gender, race, and region, it is necessary to establish prevention policies and programs tailored to high-risk areas and populations at the national and regional levels [30,37,39,52]. Policies based on injury prevention are needed, as shown by the effectiveness of policy and enforcement interventions such as speed limits, traffic lights, speed-camera enforcement to reduce injury and mortality rates due to car accidents, and installation of smoke alarms to reduce fire-related incidents [31,33].
It appears that the impacts of medical resources and environmental factors on trauma outcomes are not attributed to a single factor, but rather a complex interplay of multiple factors. In order for such strategies to be realized, several factors should be considered. First, more domestic trauma case studies should be conducted, as there have been too few conducted in Korea to fully understand the risk factors for major trauma. Among the 32 studies [16,24–54] assessed herein, only two [34,51] analyzed domestic cases. Second, case studies of impairment should be also conducted, as there have been significantly fewer domestic studies addressing impairment due to trauma than those addressing death due to trauma, In addition, rather than using objective indicators, the domestic case studies employed relatively subjective indicators, including surveys, number of work absences after accidents, and availability of hospice wards. Finally, articles published in other countries have used various geographic variables such as time of transfer, type of vehicle for transfer, number of beds, and variables related to trauma centers. In future studies, Korea should consider incorporating similar geographic variables.
This systematic review has a few limitations. First, we focused only on geographic variables and excluded other variables. Second, we categorized geographic factors into socioeconomic, environmental, and medical-resource–related categories, and articles analyzing other topics were not considered. Despite these limitations, this study is meaningful as it presents the trends in trauma care, as determined through variables, analytical methods, and research outcomes.
In conclusion, although further research is needed, our study showed that geographic factors, including socioeconomic, medical resource, and environmental factors, such as population density, region (e.g., metropolis, rural), income levels of the area, and presence of trauma centers, appear to influence trauma outcomes. In order to reduce the incidence of death and disability due to trauma, it is important to establish appropriate care plans that take into account geographical factors. One approach could be to develop regional trauma care systems that address specific treatment difficulties in different areas.
SUPPLEMENTARY MATERIAL
Supplementary materials are available from https://doi.org/10.15441/ceem.23.009.
Supplementary Table 1.
. Result of assess of study using QualSyst (Alberta Heritage Foundation for Medical Research)
Notes
ETHICS STATEMENT
Not applicable.
CONFLICT OF INTEREST
No potential conflict of interest relevant to this article was reported.
FUNDING
None.
AUTHOR CONTRIBUTIONS
Conceptualization: BH, TJ; Data curation: BH, TJ; Formal analysis: BH, JJ; Methodology: BH, TJ; Writing–original draft: BH; Writing–review & editing: TW, JJ. All authors read and approved the final manuscript.
References
Article information Continued
Notes
Capsule Summary
What is already known
In the past, trauma was thought to impact low-income people to a greater degree because of poor medical access. The outcomes of trauma are influenced by various factors such as age, mechanism, surrounding environment, and other factors.
What is new in the current study
This study, through a systematic literature review, show that the factors affecting trauma treatment outcomes are not only individual, but also socioeconomic status, population density of residence area, surrounding environment, and other factors.