| Home | E-Submission | Sitemap | Contact Us |  
Search
Clin Exp Emerg Med Search

CLOSE

Clin Exp Emerg Med > Volume 6(2); 2019 > Article
Yoon, Kwon, An, Hong, and Kim: Main outcomes of the sudden cardiac arrest survey 2006 to 2016

STRUCTURE OF THE SUDDEN CARDIAC ARREST SURVEY

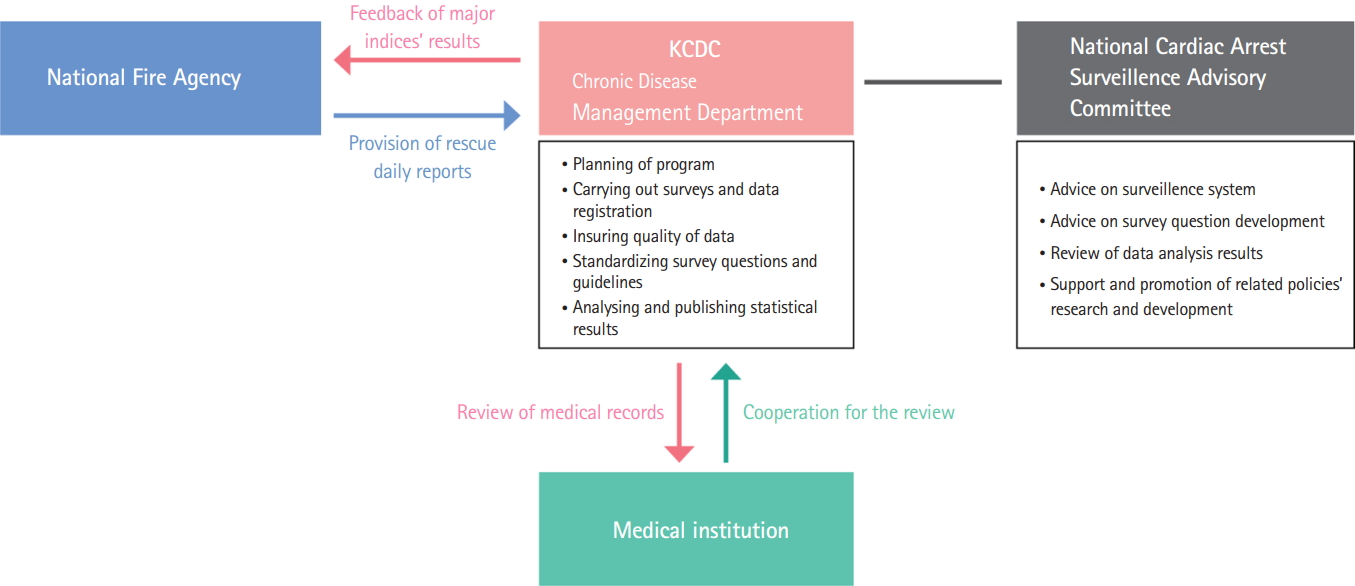
The Korea Centers for Disease Control and Prevention (KCDC) performs various tasks related to public health and epidemiology, including the planning and administration of medical record surveys, assurance of data quality, standardization of survey questions and guidelines, analysis of results, production of main indices, and publication of statistics. The National Cardiac Arrest Survey and Monitoring Advisory Committee comprises specialists in related departments and academic institutions. This committee provides technical assistance and advice regarding the maintenance of a survey-monitoring system, development of questionnaires, and review and analysis of results with the intent to support policy development and stimulate research. These works are conducted in cooperation with the National Fire Agency, 17 “Si (cities)-Do (provinces)” Fire and Disaster Headquarter centers, and approximately 600 medical institutions. From the rescue activity records of the “Si–Do” Fire and Disaster Headquarters, which are provided by the National Fire Agency, the KCDC selects cases involving sudden cardiac arrest, standardizes the names of hospitals to which patients are transferred, and establishes a surveillance database. Subsequently, dedicated survey personnel employed by the KCDC visit approximately 600 hospitals identified as receiving transferred patients and survey the pertinent medical records. All involved hospitals cooperate actively with this work (Fig. 1).

INCIDENCE OF SUDDEN CARDIAC ARREST AND SURVIVAL STATUS

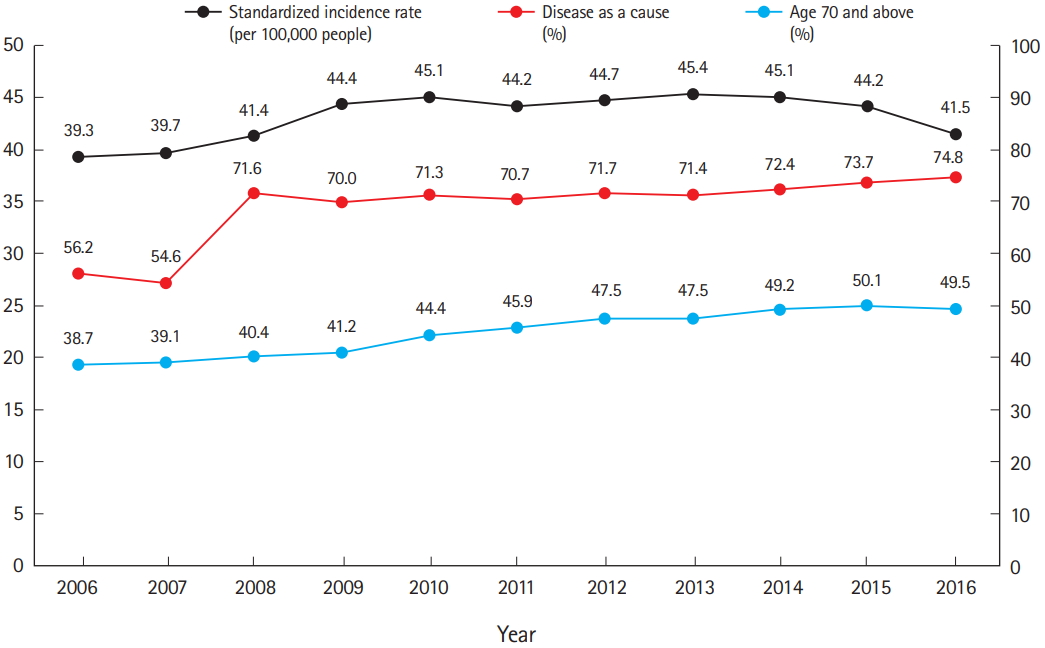
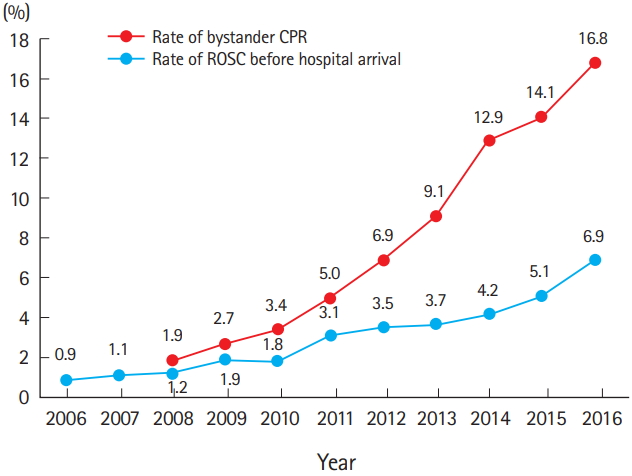
The number of cases of sudden cardiac arrest increased by 1.5-fold from 19,480 in 2006 to 29,832 in 2016, while the standardized incidence rate increased by 1.1-fold from 39.3 (per 100,000 population) to 41.5 during the same period (Fig. 2). The demographic features of cardiac arrest patients also changed with the overall demographic structure during the 11-year study period, as demonstrated by the sharp increase in the proportion of elderly patients (aged ≥70 years) from 38.7% in 2006 to 49.5% in 2016. Similarly, the proportion of arrests attributed to “disease” increased. The rates of survival and neurological recovery increased each year, with the former increasing by 3.3-fold from 2.3% in 2006 to 7.6% in 2016 (Fig. 3). Regarding the latter, the proportion of patients who neurologically recovered sufficiently to achieve independence with tasks of daily living increased by 7-fold, from 0.6% in 2006 to 4.2% in 2016. Improved survival and neurological recovery also rely on the rate of cardiopulmonary resuscitation (CPR) performed by non-medical personnel (i.e., a layperson). Notably, this rate increased significantly from 1.9% in 2008 to 16.8% in 2016, and the annual trend continues to increase (Fig. 4). Furthermore, the rate of return of spontaneous circulation before hospital arrival, an indicator of the paramedics’ capability, also increased by 7.7-fold from 0.9% in 2006 to 6.9% in 2016.

STATUS OF SUDDEN CARDIAC ARRESTS IN EACH REGION

Large disparities in the values of major indices associated with sudden cardiac arrest were observed among regions. Although the underlying cause remains unclear, the tendency of these disparities to increase highlights the need to produce relevant indices, and the data needs to be provided to the communities for local cooperation in the developement and implementation of effective policies. Notably, increases in regional disparities were observed both in the rate of CPR performed by a layperson and the rate of return of spontaneous circulation before hospital arrival, and trends toward increasing regional disparities were observed in the rates of survival and neurological recovery, an indicator of treatment results. These disparities also increased with respect to the type of city. For example, Seoul, which is unique among the various city types, exhibited better overall performances and magnitudes of improvement with respect to survival and neurological recovery, compared to other city types (Tables 1, 2).
The timely administration of treatment is crucial during a sudden cardiac arrest, and patient prognosis improves only in the presence of effective and organic flow between different strata (i.e., regional society, emergency response, and hospital stages). Therefore, the survival rate following sudden cardiac arrest can be considered an indicator of a nation’s entire emergency medical system. The introduction of a sudden cardiac arrest survey program in 2008 enabled the objective assessment of issues related to sudden cardiac arrest and the generation of comparable regional statistics and individualized evidence-based policies. From this, we could confirm that overall survival of sudden cardiac arrests improved nationwide while regional disparities widened.
According to a recent study, the survival rate among cases of sudden cardiac arrest increased by 1.4-fold as the proportion of the population educated in CPR increased by 10% [1]. However, a community health survey (citizen health statistics) conducted annually by 254 community health centers as stated by community health law found that although the proportion of the overall population educated in CPR improved, regional disparities were apparent [2]. Accordingly, central and local governments should focus not only on improving overall survival nationwide, but should also reinforce policies that aim to reduce these widening gaps. Finally, we hope that the regional statistics yielded by the Sudden Cardiac Arrest Survey will promote initiatives aimed at improving the survival of community-dwelling patients who experience sudden cardiac arrest.

NOTES

No potential conflict of interest relevant to this article was reported.

REFERENCES

1. Ro YS, Shin SD, Song KJ, et al. Public awareness and self-efficacy of cardiopulmonary resuscitation in communities and outcomes of out-of-hospital cardiac arrest: a multi-level analysis. Resuscitation 2016; 102:17-24.
crossref pmid
2. Korea Centers for Disease Control and Prevention. 2008-2016 Community health statistics at a glance. Cheongju: Korea Centers for Disease Control and Prevention; 2017.

Fig. 1.
Sudden cardiac arrest survey system. KCDC, Korea Centers for Disease Control and Prevention.
ceem-18-074f1.jpg
Fig. 2.
Trends of sudden cardiac arrest.
ceem-18-074f2.jpg
Fig. 3.
Trends in survival rate and neurological recovery rate.
ceem-18-074f3.jpg
Fig. 4.
Trends in rate of bystander cardiopulmonary resuscitation (CPR) and rate of return of spontaneous circulation (ROSC) before hospital arrival.
ceem-18-074f4.jpg
Table 1.
Disparities in Sudden cardiac arrest survey main indices, 2006-2016
Index Value 2006 2007 2008 2009 2010 2011 2012 2013 2014 2015 2016
Rate of CPR performed by layperson (%) Total - - 1.9 2.7 3.4 5.0 6.9 9.1 12.9 14.1 16.8
Seoul - - 3.1 5.5 7.3 12.3 17.4 19.8 26.2 23.6 29.6
Busan - - 1.6 1.7 1.6 4.6 4.8 7.0 9.9 11.2 13.3
Daegu - - 1.6 3.0 4.1 5.5 6.1 9.6 12.9 18.3 23.6
Incheon - - 2.4 4.9 5.3 6.2 6.9 8.0 14.6 13.0 16.6
Gwangju - - 0.9 1.4 1.5 2.8 3.8 4.4 10.1 8.2 8.1
Daejeon - - 1.5 1.7 2.3 3.9 4.6 9.1 16.2 14.4 20.8
Ulsan - - 1.6 1.3 1.6 4.9 4.7 7.3 8.1 14.9 20.7
Sejong - - - - - - 3.8 2.6 2.6 7.1 13.4
Gyeonggi - - 2.2 2.7 4.0 5.1 6.8 8.5 12.6 16.3 18.9
Gangwon - - 2.1 2.8 3.7 3.4 4.1 8.4 11.7 15.2 16.2
Chungbuk - - 0.9 1.1 1.7 2.4 3.9 5.9 7.0 9.0 13.9
Chungnam - - 1.5 1.2 2.8 3.3 4.4 6.6 9.3 8.4 12.1
Jeonbuk - - 2.2 2.1 2.4 3.6 4.2 8.0 11.4 11.3 9.7
Jeonnam - - 1.5 1.3 1.2 1.1 3.2 4.2 6.4 6.3 6.1
Gyeongbuk - - 0.9 1.0 1.0 1.4 2.8 4.2 4.6 8.1 8.0
Gyeongnam - - 0.6 1.8 1.3 3.2 4.7 6.2 8.2 9.7 11.5
Jeju - - 1.4 2.5 1.9 3.5 5.4 8.5 11.7 17.9 17.0
Disparity (max-min) - - 2.5 4.5 6.3 11.2 14.6 17.2 23.6 17.3 23.5
Rate of ROSC before hospital arrival (%) Total 0.9 1.1 1.2 1.9 1.8 3.1 3.5 3.7 4.2 5.1 6.9
Seoul 1.2 1.3 1.5 2.6 2.0 2.8 4.1 4.5 5.0 6.2 7.7
Busan 0.9 0.8 1.7 2.3 2.0 3.0 4.6 5.1 5.6 6.7 10.2
Daegu 1.3 0.4 0.6 1.6 2.2 3.6 3.3 4.7 4.3 5.6 9.0
Incheon 0.3 1.1 1.9 1.8 2.0 3.8 3.3 3.8 5.0 5.5 7.5
Gwangju 0.2 0.8 2.0 1.6 2.4 5.2 3.8 4.2 5.6 4.5 9.4
Daejeon 0.4 1.1 1.4 1.2 3.0 3.9 3.1 5.6 4.8 4.3 7.3
Ulsan 0.3 1.6 0.8 2.5 3.4 4.0 4.9 4.3 6.4 4.7 9.3
Sejong - - - - - - 3.5 3.8 6.2 7.5 15.3
Gyeonggi 1.3 1.4 1.3 1.9 1.8 3.0 3.9 3.4 4.6 5.8 8.4
Gangwon 1.8 0.5 1.0 1.8 2.3 2.4 2.4 2.3 4.2 4.0 5.1
Chungbuk 1.3 1.1 0.6 2.1 1.0 3.3 2.1 3.4 3.0 3.0 4.7
Chungnam 0.8 1.4 0.4 1.5 1.0 4.4 3.0 2.5 2.3 2.6 5.8
Jeonbuk 0.6 0.6 0.5 1.5 1.6 4.1 3.7 4.7 4.4 4.7 4.1
Jeonnam 0.7 1.6 1.0 1.6 1.8 2.5 2.7 2.3 2.4 4.1 3.0
Gyeongbuk 0.9 1.0 1.1 1.5 0.9 1.7 2.4 2.7 2.2 3.6 4.4
Gyeongnam 0.4 0.4 0.8 1.8 1.4 2.5 2.5 2.9 3.2 4.6 5.1
Jeju 0.7 1.2 1.2 2.6 1.6 4.9 5.5 3.9 3.3 5.1 5.1
Disparity (max-min) 1.6 1.2 1.6 1.4 2.5 3.5 3.4 3.3 4.2 4.9 12.3
Survival rate (%) Total 2.3 2.6 2.5 3.3 3.3 4.1 4.4 4.8 4.8 6.3 7.6
Seoul 3.9 5.0 4.9 6.4 6.3 8.3 8.8 9.2 8.6 9.8 11.4
Busan 0.6 2.0 2.0 3.5 3.6 4.5 4.4 5.3 5.7 7.6 9.1
Daegu 2.2 1.3 1.7 2.4 2.4 3.7 4.7 6.1 5.4 5.1 7.0
Incheon 4.3 3.9 4.5 4.1 4.0 5.8 5.3 6.7 5.8 7.2 8.2
Gwangju 3.2 2.0 3.1 4.6 4.0 4.1 2.9 4.6 3.9 7.6 9.2
Daejeon 4.4 3.9 4.2 4.2 8.1 6.6 6.8 7.9 7.3 7.1 8.4
Ulsan 1.4 1.9 0.5 2.7 4.4 3.3 3.8 3.0 4.5 6.4 10.9
Sejong - - - - - - 5.3 2.6 3.7 2.2 11.9
Gyeonggi 3.0 3.4 2.8 3.7 3.3 4.0 4.8 4.8 5.7 6.8 8.2
Gangwon 3.2 2.4 1.9 2.9 4.1 3.1 3.6 3.8 4.5 4.7 6.1
Chungbuk 1.7 1.2 1.4 2.0 1.5 3.0 2.5 3.8 2.8 3.9 5.3
Chungnam 0.3 0.7 0.7 1.2 0.7 2.5 2.6 1.9 1.9 3.5 6.1
Jeonbuk 1.1 2.4 1.2 1.5 2.1 3.0 2.9 4.4 3.2 4.8 5.1
Jeonnam 0.9 1.4 1.4 1.4 1.2 1.7 1.6 1.2 1.1 4.4 4.7
Gyeongbuk 0.7 0.6 1.1 1.3 1.1 1.6 1.4 1.8 1.3 3.4 4.3
Gyeongnam 0.2 0.5 1.9 1.8 1.1 1.6 2.1 2.3 2.6 4.5 5.5
Jeju 1.4 2.7 1.8 3.2 2.8 3.5 4.6 3.6 3.6 7.4 6.2
Disparity (max-min) 4.2 4.5 4.4 5.2 7.4 6.7 7.4 8.0 7.5 7.6 7.6
Neurological recovery rate (%) Total 0.6 0.7 0.8 1.0 0.9 1.6 1.8 2.3 2.7 3.6 4.2
Seoul 0.8 1.6 1.5 1.7 1.6 2.9 3.3 3.9 4.9 5.8 6.0
Busan 0.0 0.4 0.3 1.2 0.8 1.9 2.2 3.0 3.1 4.6 5.3
Daegu 1.1 0.0 0.9 1.1 1.2 2.2 2.3 3.9 3.7 3.7 5.4
Incheon 1.0 1.1 0.8 1.3 1.4 2.1 2.2 3.0 3.8 3.8 4.5
Gwangju 0.2 0.6 0.9 1.1 0.6 2.1 1.6 2.2 2.2 3.7 4.8
Daejeon 1.6 1.5 1.4 0.3 1.4 2.9 1.9 3.8 3.3 3.9 4.0
Ulsan 0.6 1.1 0.3 1.0 2.1 0.9 2.3 1.5 2.6 4.0 6.2
Sejong - - - - - - 1.8 2.6 3.7 0.0 9.3
Gyeonggi 0.8 0.8 0.9 0.9 1.0 1.3 2.1 2.4 2.8 3.8 4.6
Gangwon 1.4 0.9 0.6 1.7 1.4 1.1 1.0 2.1 2.5 2.5 2.5
Chungbuk 0.4 0.3 0.3 1.0 0.6 1.0 0.7 1.4 1.8 2.5 3.1
Chungnam 0.0 0.3 0.0 0.3 0.1 1.1 1.2 0.8 0.9 1.9 2.9
Jeonbuk 0.2 0.1 0.3 0.4 0.4 1.4 1.2 2.0 2.2 2.7 3.3
Jeonnam 0.2 0.1 0.7 0.2 0.3 0.4 0.5 0.6 0.4 2.3 2.0
Gyeongbuk 0.2 0.1 0.3 0.6 0.5 0.6 0.9 0.9 0.8 2.3 2.7
Gyeongnam 0.1 0.2 0.5 0.5 0.4 0.7 1.1 1.5 1.8 2.7 3.1
Jeju 0.5 1.4 0.9 1.7 1.2 2.8 2.7 2.0 2.2 4.6 3.7
Disparity (max-min) 1.6 1.6 1.5 1.5 2.0 2.5 2.8 3.3 4.5 5.8 7.3

Unit: %, %p.

CPR, cardiopulmonary resuscitation; ROSC, return of spontaneous circulation; -, null value.

Table 2.
Results of sudden cardiac arrest main indices and their disparities among city types, 2006-2016
Index City type 2006 2007 2008 2009 2010 2011 2012 2013 2014 2015 2016
Rate of CPR performed by layperson (%) Local districts of Seoul metropolitan city - - 3.1a) 5.5a) 7.3a) 12.3a) 17.4a) 19.8a) 26.2a) 23.6a) 29.6a)
Local districts of Metropolitan cityb) - - 1.9 2.8 3.5 5.0 6.4 8.8 12.8 15.2 17.7
Cities with less than 300,000 people - - 1.7 1.1c) 1.7 2.3 4.3 5.5 10.4 11.4 15.9
Urban rural consolidated cities - - 1.3 1.5 2.0 2.7 3.4 5.4 7.3 9.0 10.2
Counties - - 1.1c) 1.2 1.4c) 1.8c) 2.8c) 4.4c) 6.4c) 7.7c) 9.5c)
Disparity (max-min) - - 2.0 4.4 5.9 10.5 14.6 15.4 19.8 15.9 20.1
ROSC before hospital arrival (%) Local districts of Seoul metropolitan city 1.2a) 1.3 1.5a) 2.6a) 2.0 2.8 4.1a) 4.5a) 5.0a) 6.2a) 7.7
Local districts of Metropolitan cityb) 0.9 1.0 1.3 1.9 1.9 3.4a) 3.6 4.1 4.5 5.5 8.2a)
Cities with less than 300,000 people 0.9 1.5a) 0.9c) 1.8 2.1a) 2.2c) 3.7 3.0 4.2 5.6 6.1
Urban rural consolidated cities 0.9 1.0c) 1.0 1.7 1.6 2.9 2.9c) 2.9 3.4 3.9 4.9
Counties 0.7c) 1.0c) 0.9c) 1.6c) 1.2c) 3.0 3.0 2.8c) 3.1c) 3.6c) 4.7c)
Disparity (max-min) 0.5 0.5 0.6 1.0 0.9 1.2 1.2 1.7 1.9 2.6 3.5
Survival rate (%) Local districts of Seoul metropolitan city CR 3.9a) 5.0a) 4.9a) 6.4a) 6.3a) 8.3a) 8.8a) 9.2a) 8.6a) 9.8a) 11.4a)
Std 4.0a) 5.0a) 4.9a) 6.5a) 6.5a) 8.5a) 9.3a) 9.9a) 9.8a) 11.2a) 12.9a)
Local districts of Metropolitan cityb) CR 2.9 3.0 2.9 3.8 3.8 4.6 5.0 5.7 5.6 6.8 8.4
Std 2.8 2.9 2.9 3.8 3.9 4.7 5.2 6.0 6.1 7.5 9.2
Cities with less than 300,000 people CR 1.3 1.7 2.3 3.6 3.1 3.8 3.4 3.9 4.2 6.8 7.4
Std 1.3 1.6 2.4 3.6 2.9 3.7 3.5 4.1 4.6 8.6 8.5
Urban rural consolidated cities CR 1.0 1.1 1.4 1.6 1.6 1.8 2.2 2.1 2.2 4.3 5.5
Std 1.0 1.1 1.4 1.7 1.6 2.0 2.4 2.3 2.4 5.1 6.6
Counties CR 0.3c) 0.6c) 0.5c) 0.7c) 0.7c) 1.4c) 1.3c) 1.3c) 1.3c) 3.0c) 3.9c)
Std 0.3c) 0.6c) 0.5c) 0.8c) 0.8c) 1.6c) 1.4c) 1.6c) 1.5c) 3.7c) 4.6c)
Disparity (max-min) 3.6 4.4 4.4 5.7 5.6 6.9 7.5 7.9 7.3 6.8 7.5
Neurological recovery rate (%) Local districts of Seoul metropolitan city CR 0.8a) 1.6a) 1.5a) 1.7a) 1.6a) 2.9a) 3.3a) 3.9a) 4.9a) 5.8a) 6.0a)
Std 0.9a) 1.6a) 1.6a) 1.7a) 1.6a) 3.0a) 3.5a) 4.4a) 5.9a) 6.8a) 7.1a)
Local districts of Metropolitan city CR 0.7 0.8 0.8 1.1 1.1 1.8 2.2 2.8 3.2 4.0 4.9
Std 0.7 0.8 0.8 1.1 1.1 1.9 2.4 3.0 3.4 4.5 5.5
Cities with less than 300,000 people CR 0.7 0.6 1.2 1.1 1.1 1.3 1.2 1.8 1.8 3.3 3.2
Std 0.8 0.5 1.3 1.1 1.0 1.2 1.2 1.9 2.1 4.6 4.0
Urban rural consolidated cities CR 0.3 0.3 0.4 0.6 0.6 0.7 1.0 1.1 1.3 2.2 2.7
Std 0.4 0.3 0.4 0.7 0.6 0.8 1.2 1.3 1.5 2.6 3.5
Counties CR 0.1c) 0.1c) 0.2c) 0.3c) 0.3c) 0.6c) 0.5c) 0.8c) 0.8c) 1.9c) 2.1c)
Std 0.1c) 0.1c) 0.2c) 0.4c) 0.4c) 0.7c) 0.6c) 1.0c) 1.1c) 2.5c) 2.6c)
Disparity (max-min) 0.7 1.5 1.3 1.4 1.3 2.3 2.8 3.1 4.1 3.9 3.9

CPR, cardiopulmonary resuscitation; ROSC, return of spontaneous circulation; -, null value; CR, crude rate; Std, standardized rate.

a) Region with the highest values in the year.

b) Local districts of Metropolitan cities, cites with more than 300,000 population, or local districts of cities with more than 500,000 population or ‘Gu’ of ‘Si’ with more than 500,000 population.

c) Region with the lowest values in the year.

TOOLS
PDF Links  PDF Links
PubReader  PubReader
ePub Link  ePub Link
XML Download  XML Download
Full text via DOI  Full text via DOI
Download Citation  Download Citation
  Print
Share:      
METRICS
7
Web of Science
6
Crossref
0
Scopus
4,112
View
87
Download
Editorial Office
The Korean Society of Emergency Medicine
101-3104, Brownstone Seoul, 464 Cheongpa-ro, Jung-gu, Seoul 04510, Korea
TEL: +82-31-709-0918   E-mail: office@ceemjournal.org
About |  Browse Articles |  Current Issue |  For Authors and Reviewers
Copyright © by The Korean Society of Emergency Medicine.                 Developed in M2PI