Lee, Kim, and Ro: Epidemiology of stroke in emergency departments: a report from the National Emergency Department Information System (NEDIS) of Korea, 2018–2022
1Department of Emergency Medicine, Ajou University Hospital, Ajou University School of Medicine, Suwon, Korea
2Department of Neurology, Ajou University Hospital, Ajou University School of Medicine, Suwon, Korea
3National Emergency Medical Center, National Medical Center, Seoul, Korea
4Department of Emergency Medicine, Seoul National University Hospital, Seoul, Korea
Correspondence to: Young Sun Ro Department of Emergency Medicine, Seoul National University Hospital, 103 Daehak-ro, Jongno-gu, Seoul 03080, Korea Email: Ro.youngsun@gmail.com
Received: October 8, 2023 Accepted: October 17, 2023
The Global Burden of Disease, Injuries, and Risk Factors Study (GBD) 2019 [1] reported stroke to be the third leading cause of death and disability combined (as measured by disability-adjusted life-years) and the second leading cause of death worldwide in 2019. As per GBD 2019 [1], ischemic stroke accounted for 62.4% of all strokes and had a high risk of long-term recurrence, whereas intracerebral hemorrhage and subarachnoid hemorrhage constituted 27.9% and 9.7% of all strokes, respectively, and showed larger reductions in age-standardized rates than ischemic stroke from 1990 to 2019. In addition, the global trend prediction using the GBD 2019 database [2] showed an increase in the incidence of ischemic stroke across all sexes, age groups, and sociodemographic index quintiles from 2020 to 2030. In acute ischemic stroke, intravenous thrombolysis and mechanical thrombectomy for large vessel occlusion (LVO) within eligible therapeutic time window may be performed to reduce long-term disability from acute ischemic stroke. Globally, patients undergoing LVO account for 10% to 20% of all patients with ischemic stroke, but only <5% of patients receive treatment within the eligible therapeutic time window [3]. Several factors were responsible for prehospital delay, such as lack of awareness of the symptoms of stroke, not summoning emergency medical services, lack of effective interactions between prehospital transfer step and hospital management, and neighborhood socioeconomic status [4,5]. Therefore, stroke must be properly recognized from the prehospital stage, and patients must be transferred to institutions capable of providing appropriate treatment [6,7]. In Korea, Stroke Statistics in Korea 2018 [8] has been published by the Korean Stroke Society in 2018, but epidemiological studies based on the emergency room are insufficient. Therefore, investigating the epidemiology of ischemic and hemorrhagic stroke in patients visiting the emergency department (ED) may be the first step towards creating an appropriate emergency medical system.
ETHICS STATEMENT
The study was approved by the Institutional Review Board of the National Medical Center (No. NMC-2023-08-094). The requirement for informed consent was waived due to the retrospective nature of the study.
NEDIS DATABASE
This commentary addresses stroke epidemiology in the ED using the National Emergency Department Information System (NEDIS) database in Korea. NEDIS is an emergency information network designated by the Ministry of Health and Welfare of Korea that has been used since 2003 and is operated by the National Emergency Medical Center (NEMC; Seoul, Korea). The NEDIS database includes demographics (such as sex, age, and insurance), symptoms (chief complaints and onset), and prehospital (emergency medical services use and treatment and means of transportation) and ED hospital (level of consciousness at presentation, emergency operative procedures, critical care requirement, disposition, hospital stay after admission, and final clinical outcomes) information of all patients who visited 402 EDs nationwide. For data quality management, NEDIS data should be approved annually by Statistics Korea (Daejeon, Korea). NEMC manages NEDIS data and uses it for emergency medical service quality measurement [9–12].
EPIDEMIOLOGY OF STROKE IN THE ED
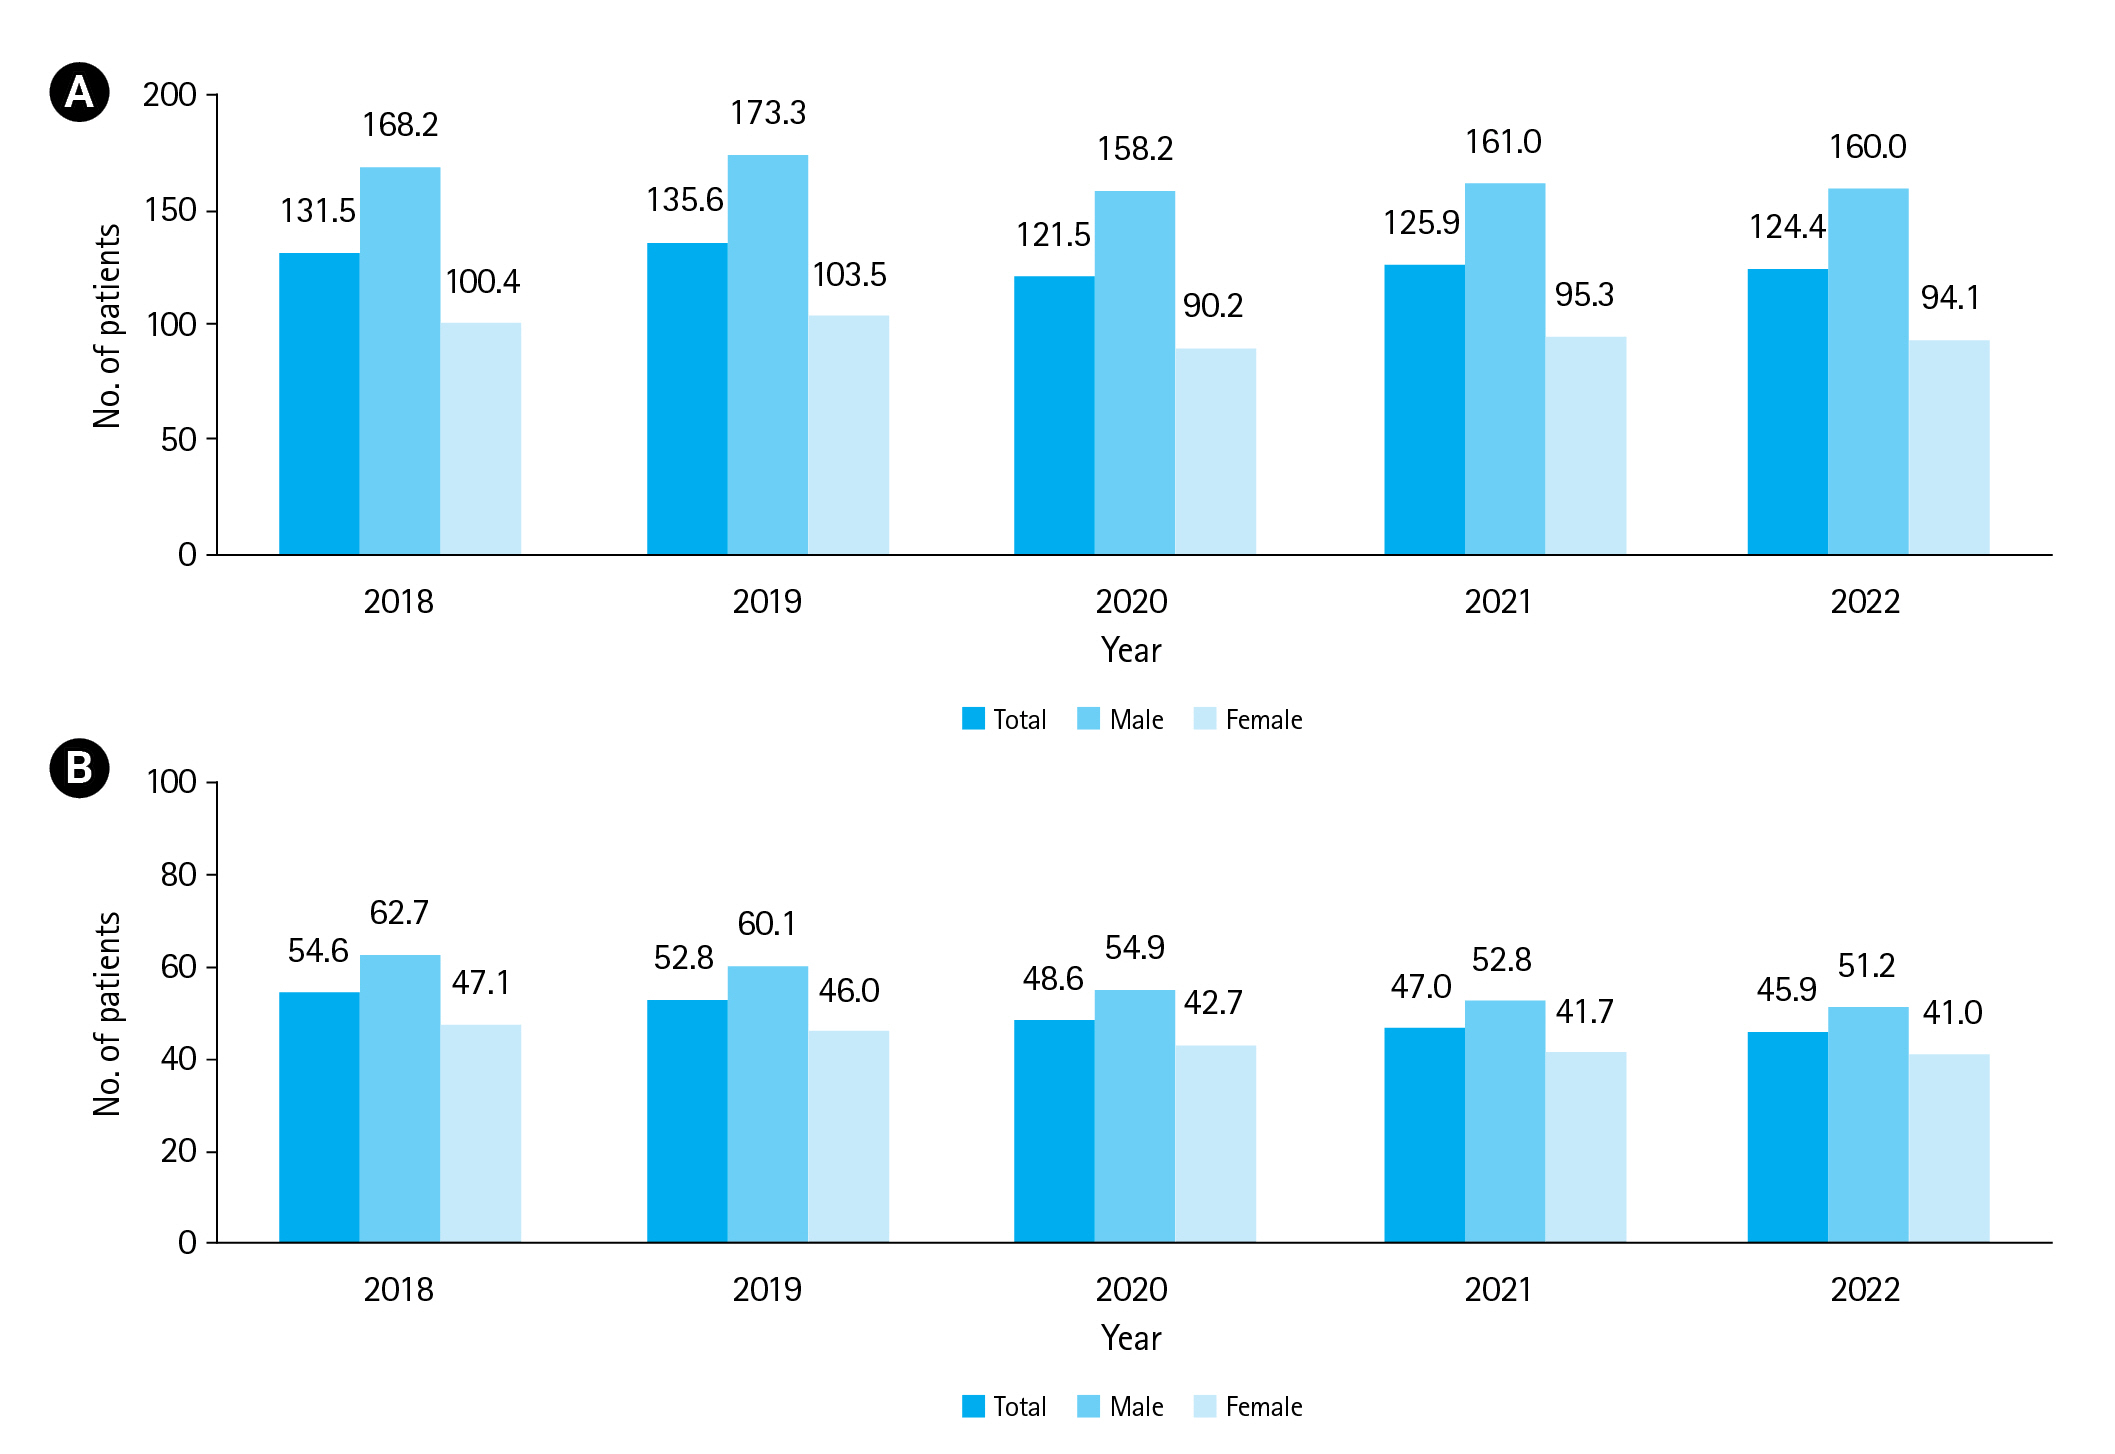
Between 2018 and 2022, 458,514 patients with acute stroke visited the ED. Of these, 330,275 (72.0%) had acute ischemic stroke, and 128,239 (28.0%) had acute hemorrhagic stroke. The age- and sex-standardized incidence rate per 100,000 population of acute ischemic stroke tended to decrease during the COVID-19 pandemic period, after which it slightly increased after the COVID-19 pandemic period. However, the incidence of acute hemorrhagic stroke decreased annually (Fig. 1). The average age of patients with acute ischemic stroke (70.0±13.8 years) was higher than that of patients with acute hemorrhagic stroke (63.7±16.1 years). Overall, acute ischemic stroke and hemorrhagic stroke had a high incidence in men. However, in acute hemorrhagic stroke, women aged ≥65 years showed a higher incidence than men of the same age group. The time from stroke onset to ED visit was longer in patients with ischemic stroke (median, 173 minutes; interquartile range [IQR], 61–480 minutes) than in those with hemorrhagic stroke (median, 91 minutes; IQR, 44–250 minutes). This duration was longer in patients aged ≥65 years than that in the other age groups. Almost all patients with stroke were transferred to institutions higher than level II centers. A total of 18.8% of the patients with acute ischemic stroke and 25.8% of the patients with acute hemorrhagic stroke visited the ED through other medical institutions. A total of 61.1% of patients with acute ischemic stroke and 79.9% of patients with acute hemorrhagic stroke were transferred by the ambulance system, of which transfers through the 119 ambulance accounted for the largest portion. Further, 81.7% of the patients with acute ischemic stroke and 81.9% of the patients with acute hemorrhagic stroke were admitted. Death in the ED occurred in 0.2% of the patients with acute ischemic stroke and 1.5% of the patients with acute hemorrhagic stroke (Tables 1, 2).
PATIENT CHARACTERISTICS ACCORDING TO TYPE OF ED
Sixty percent of patients with stroke visited level II centers and 40% visited level I centers. Patients who were transferred from other hospital were more in level I centers than level II centers. The length of stay in the ED was longer in level I centers (acute ischemic stroke, 407.3±476.0 minutes; acute hemorrhagic stroke, 340.5±508.3 minutes) than in level II centers (acute ischemic stroke, 338.6±409.1 minutes; acute hemorrhagic stroke, 267.5±391.4 minutes). In the case of acute ischemic stroke, 84.2% of patients who visited level I centers and 79.9% of patients who visited level II centers were hospitalized. Among the hospitalized patients, a greater proportion was admitted to the intensive care units of level I centers (37.6%) than those of level II centers (30.9%). In the case of patients with acute hemorrhagic stroke, 85.3% of the patients who visited level I centers were hospitalized, and 79.6% of the patients who visited level II centers were hospitalized. Among hospitalized patients, more were admitted to the intensive care unit at level I centers (81.5%) than level II centers (78.7%) (Tables 1, 2).
OUTCOME OF STROKE AT HOSPITAL DISCHARGE
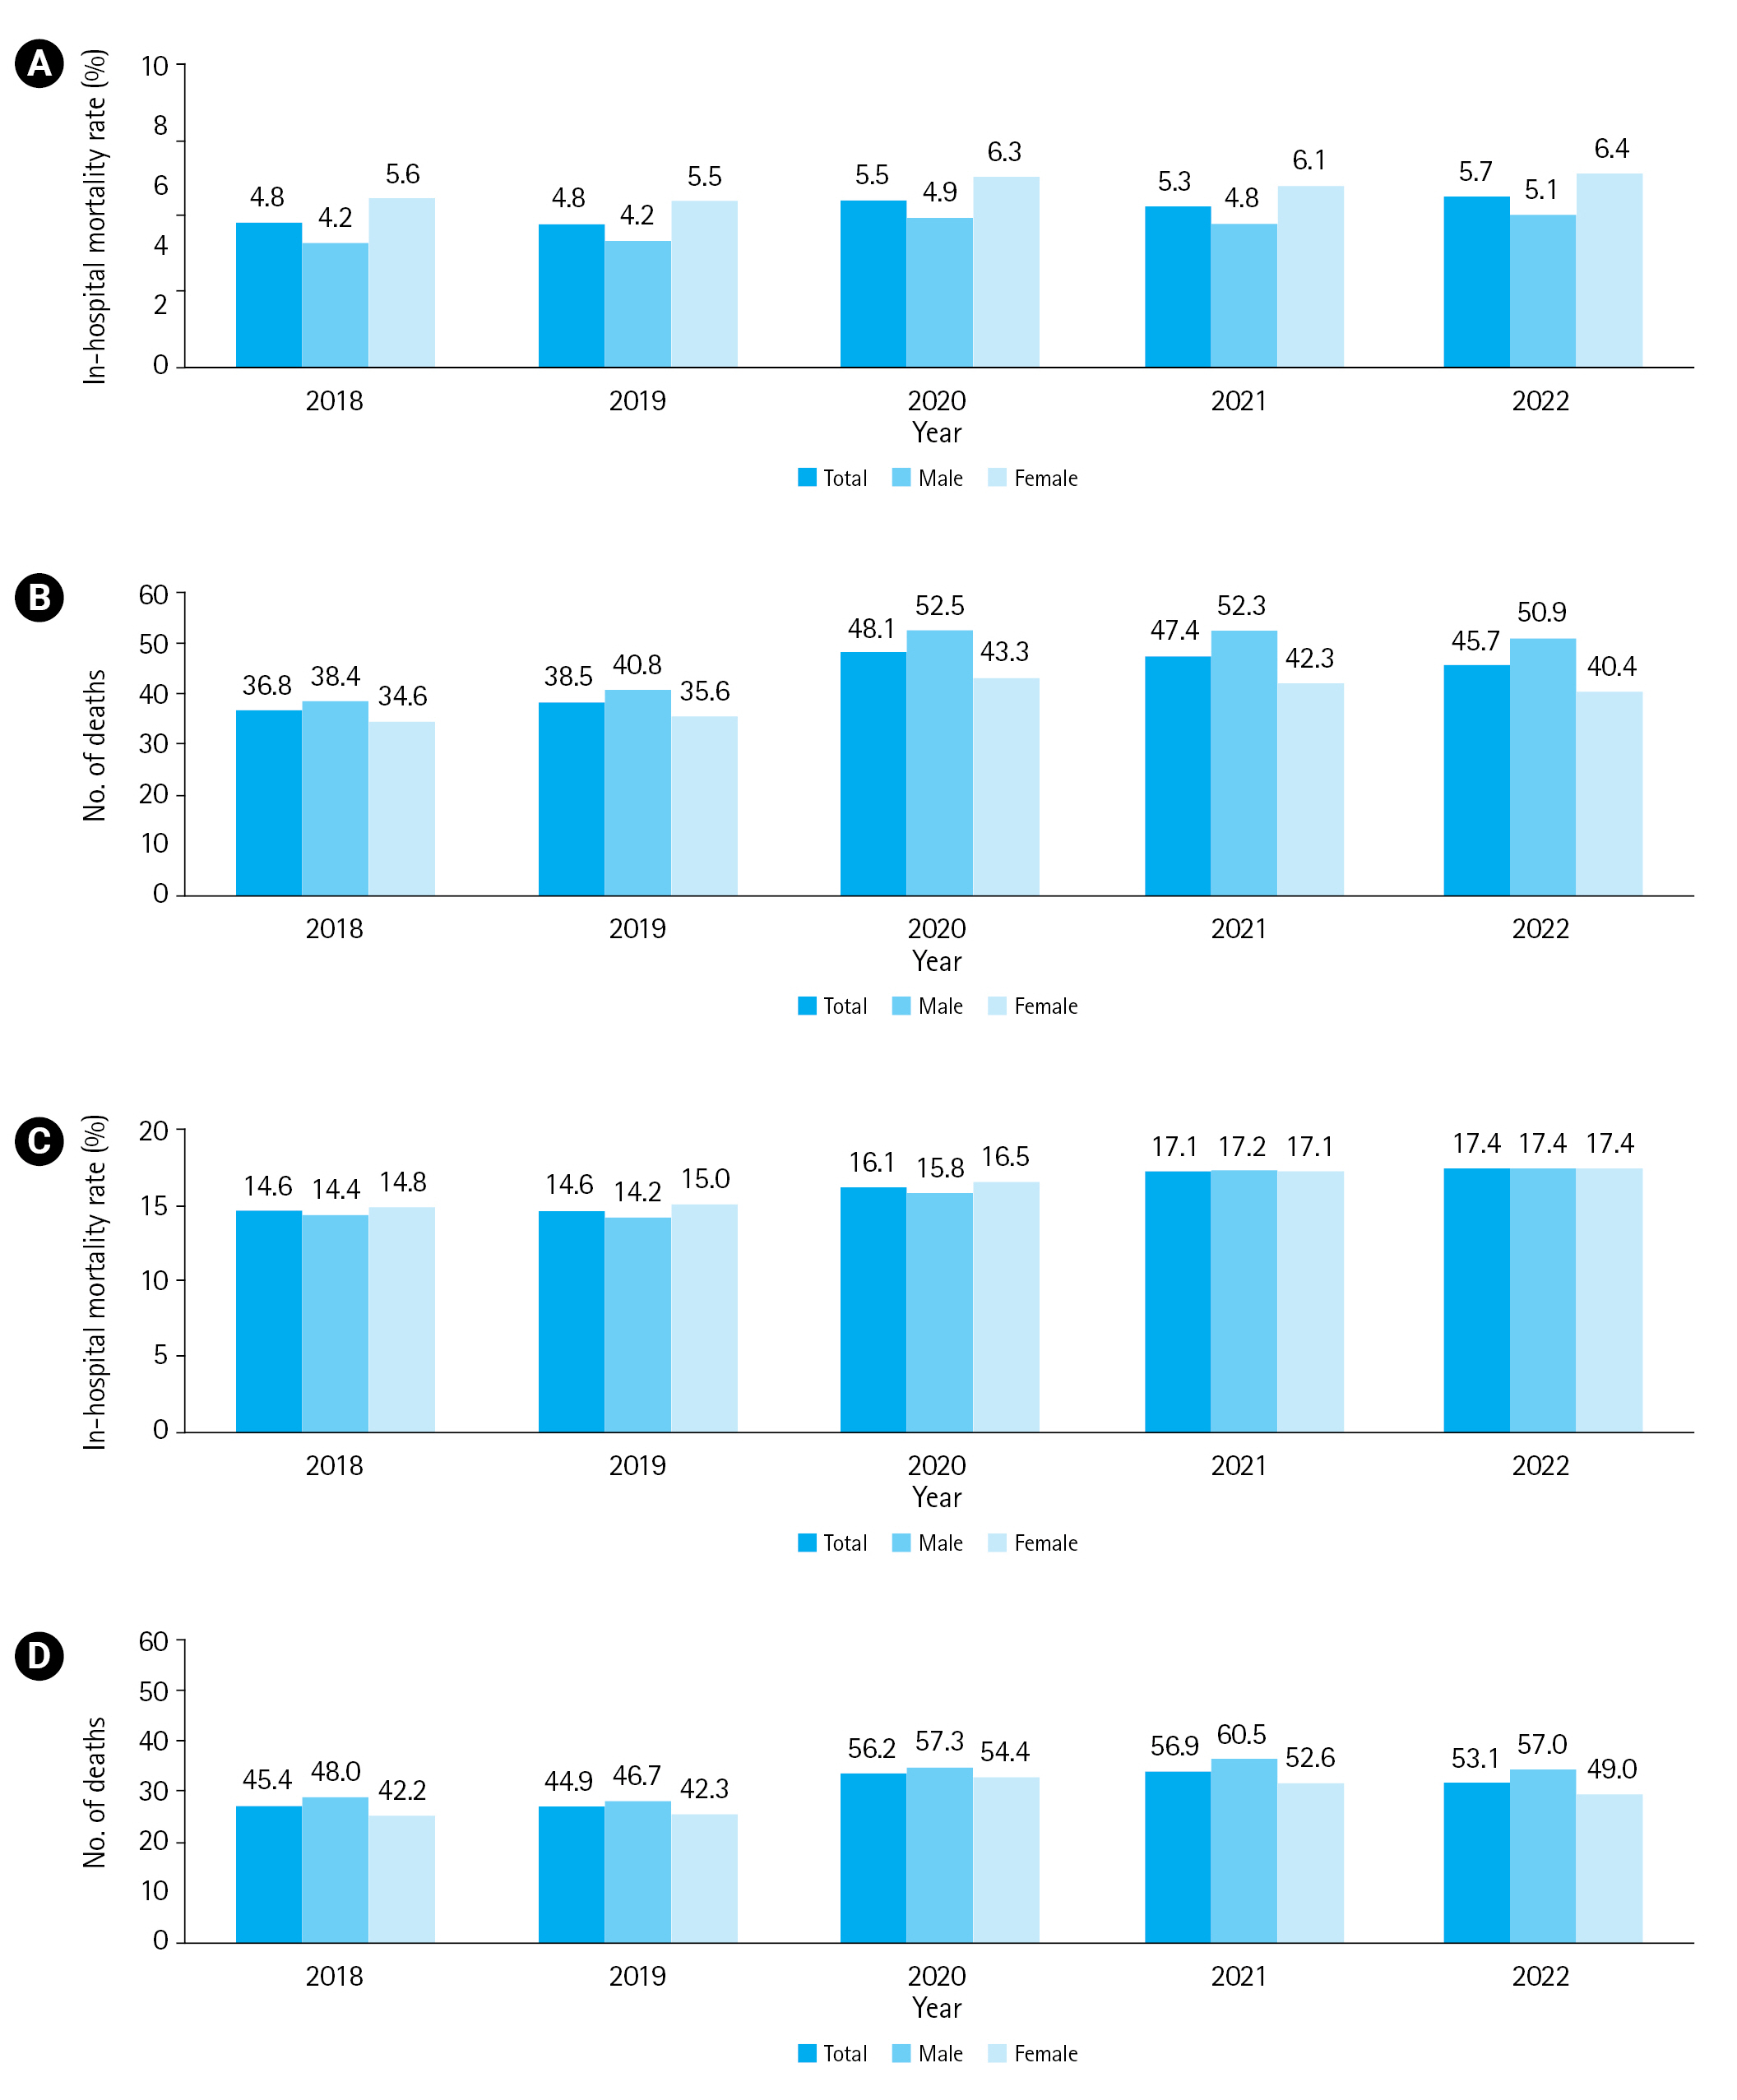
The incidence of in-hospital death or hopeless discharge was 5.4% in acute ischemic stroke and 17.7% in acute hemorrhagic stroke. The in-hospital mortality rate and mortality per 100,000 ED visits increased since the COVID-19 pandemic period (Fig. 2). The mortality rate tended to increase with age. No significant differences were observed according to the type of emergency medical center (Tables 1, 2).
INSIGHTS AND CHALLENGES
On examining the 5-year trend, we observed that the incidence of acute ischemic stroke increased with age. However, the duration from symptom onset to ED visit increased with the increase in age. Earlier admission and early neurosurgical intervention were associated with favorable outcomes in acute ischemic stroke and spontaneous hemorrhagic stroke [13,14]. Several stroke recognition systems and educational programs have been developed and implemented in prehospital settings [15]. In the future, a tailored approach involving effective educational programs on stroke recognition and initial behavioral guidelines for laypersons, especially the older population, is needed. Second, the frequency of both ischemic and hemorrhagic stroke increased in women over 65 years of age. Stroke is a particularly important condition in women. There are female-specific risk factors, and the outcomes of stroke in women are worse than that in men [16]. Therefore, stroke prevention and risk factor management are necessary in older women. Third, the length of stay in regional emergency medical centers was longer than that in local emergency medical centers. This may be associated with crowding disparities between the ED [9]. Delays in timely ED admission are associated with poor patient outcomes [17]. Therefore, an emergency medical service system that can efficiently use limited medical resources by accurately triaging patients from a prehospital setting and transferring them to appropriate institutions needs to be developed [6,10]. Stroke is an important disease entity that requires adequate treatment within an eligible therapeutic time window. Analyzing the statistics of ED visits is a basic step in developing an appropriate emergency medical system for patients with stroke. In the future, it will be necessary to develop emergency medical policies based on this database.
CONCLUSION
The characteristics of patients with stroke visiting the ED were investigated through an analysis of the NEDIS database over the past 5 years. In the future, based on these surveys, it will be necessary to establish an emergency medical system suitable for Korea.
NOTES
Author contributions
Conceptualization: all authors; Data curation: HJK, YSR; Methodology: all authors; Project administration: YSR; Visualization: SEL, HJK; Writing–original draft: SEL; Writing–review & editing: all authors. All authors read and approved the final manuscript.
Conflicts of interest
The authors have no conflicts of interest to declare.
Funding
The authors received no financial support for this study.
Data availability
Data of this study are from the National Emergency Medical Center (NEMC; Seoul, Korea) under the Ministry of Health and Welfare of Korea, which were used under license for the current study. Although the data are not publicly accessible, they are available from the corresponding author upon reasonable request with permission from the NEMC.
REFERENCES
1. GBD 2019 Stroke Collaborators. Global, regional, and national burden of stroke and its risk factors, 1990-2019: a systematic analysis for the Global Burden of Disease Study 2019. Lancet Neurol 2021; 20:795-820.
2. Pu L, Wang L, Zhang R, Zhao T, Jiang Y, Han L. Projected global trends in ischemic stroke incidence, deaths and disability-adjusted life years from 2020 to 2030. Stroke 2023; 54:1330-9.
3. Saini V, Guada L, Yavagal DR. Global epidemiology of stroke and access to acute ischemic stroke interventions. Neurology 2021; 97(20 Suppl 2):S6-16.
4. Jiang B, Ru X, Sun H, et al. Pre-hospital delay and its associated factors in first-ever stroke registered in communities from three cities in China. Sci Rep 2016; 6:29795.
5. Kim KH, Ro YS, Shin SD, Kim SJ. Association between neighborhood socioeconomic status and mechanical thrombectomy for acute ischemic stroke: a nationwide multilevel observational study. Acad Emerg Med 2023; 30:918-26.
6. Zachrison KS, Nielsen VM, de la Ossa NP, et al. Prehospital stroke care part 1: emergency medical services and the stroke systems of care. Stroke 2023; 54:1138-47.
7. Han S, Song SW, Hong H, et al. Uncooperative patients suspected of acute stroke ineligible for prehospital stroke screening test by emergency medical service providers: final hospital diagnoses and characteristics. Clin Exp Emerg Med 2023; 10:213-23.
8. Kim JY, Kang K, Kang J, et al. Executive summary of stroke statistics in Korea 2018: a report from the Epidemiology Research Council of the Korean Stroke Society. J Stroke 2019; 21:42-59.
9. Cha WC, Ahn KO, Shin SD, Park JH, Cho JS. Emergency department crowding disparity: a nationwide cross-sectional study. J Korean Med Sci 2016; 31:1331-6.
10. Park JH, Song KJ, Shin SD. The prehospital emergency medical service system in Korea: its current status and future direction. Clin Exp Emerg Med 2023; 10:251-4.
11. Pak YS, Ro YS, Kim SH, et al. Effects of emergency care-related health policies during the COVID-19 pandemic in Korea: a quasi-experimental study. J Korean Med Sci 2021; 36:e121.
12. Kim S, Kang H, Cho Y, et al. Emergency department utilization and risk factors for mortality in older patients: an analysis of Korean National Emergency Department Information System data. Clin Exp Emerg Med 2021; 8:128-36.
13. Nagao Y, Nakajima M, Inatomi Y, et al. Pre-hospital delay in patients with acute ischemic stroke in a multicenter stroke registry: K-PLUS. J Stroke Cerebrovasc Dis 2020; 29:105284.
14. Kim KH, Ro YS, Park JH, Jeong J, Shin SD, Moon S. Association between time to emergency neurosurgery and clinical outcomes for spontaneous hemorrhagic stroke: a nationwide observational study. PLoS One 2022; 17:e0267856.
15. Meyran D, Cassan P, Avau B, Singletary E, Zideman DA. Stroke recognition for first aid providers: a systematic review and meta-analysis. Cureus 2020; 12:e11386.
16. Yoon CW, Bushnell CD. Stroke in women: a review focused on epidemiology, risk factors, and outcomes. J Stroke 2023; 25:2-15.
17. Jones S, Moulton C, Swift S, et al. Association between delays to patient admission from the emergency department and all-cause 30-day mortality. Emerg Med J 2022; 39:168-73.
Fig. 1.
Annual changes in the age- and sex-standardized incidence rates per 100,000 population of acute stroke visiting emergency department for 5 years (2018–2022) in Korea. (A) Acute ischemic stroke. (B) Acute hemorrhagic stroke.
Fig. 2.
Annual changes in the in-hospital mortality of patients with acute stroke over 5 years (2018–2022) in Korea. (A) In-hospital mortality rate of acute ischemic stroke. (B) Age- and sex-standardized mortality rates per 100,000 emergency department visits of acute ischemic stroke. (C) In-hospital mortality rate of acute hemorrhagic stroke. (D) Age- and sex-standardized mortality rates per 100,000 emergency department visits of acute hemorrhagic stroke.
Table 1.
Patient demographics, ED visit characteristics, and outcomes of acute ischemic stroke by age group and type of institution









 PDF Links
 PubReader
 ePub Link
 XML Download
 Full text via DOI
 Download Citation
  Print
Print