| Home | E-Submission | Sitemap | Contact Us |  
Search
Clin Exp Emerg Med Search

CLOSE

Clin Exp Emerg Med > Volume 10(S); 2023 > Article
Kim, Yoon, Park, Hong, and Ro: Mortality and incidence rate of acute severe trauma patients in the emergency department: a report from the National Emergency Department Information System (NEDIS) of Korea, 2018–2022

INTRODUCTION

Trauma-related deaths should be recognized as a significant public health concern due to their frequent occurrence among the younger population and their high prevalence and mortality rates, as well as their social and economic impacts [1,2]. Traumatic injuries account for approximately 40 million emergency department (ED) visits annually in the United States alone [2,3]. Globally, they account for approximately six million annual deaths. Furthermore, trauma remains the leading cause of mortality among individuals younger than 46 years, comprising nearly half of all fatalities within this age group [46]. Therefore, it is important to increase the survival rate and enable these individuals to return to productive roles in society. This study investigated the demographics, incidence rates, and mortality rates of severe trauma cases in the ED setting. Information was extracted for acute severe trauma patients from a Korean national database of EDs, National Emergency Department Information System (NEDIS) [7,8]. The data were analyzed for epidemiologic characteristics of severe trauma patients visiting EDs over a 5-year period (2018–2022). We investigated demographic characteristics, incidence rates, and mortality rates and attempted to provide essential data useful for patient treatment and management of limited resources.

Ethics statement

The study was approved by the Institutional Review Board of the National Medical Center (No. NMC-2023-08-094). The requirement for informed consent was waived due to the retrospective nature of the study.

DATA SOURCES

This study was a retrospective secondary investigation using data from the NEDIS, collected and managed by the National Emergency Medical Center (Seoul, Korea) and controlled by the Korean government (Ministry of Health and Welfare) since 2003. The NEDIS includes clinical and administrative data of all patients who have visited EDs across the country. We focused on data registered from January 1, 2018, to December 31, 2022, specifically including severe trauma patients with an International Classification of Diseases–based Injury Severity Score (ICISS) less than 0.9, as per the 2020 criteria, indicating a predicted survival probability based on diagnosis of less than 90%, as severe trauma cases. Data were limited to the time from injury occurrence to 24 hours after hospital admission and excluded patients who visited the ED for postinjury complications, among other reasons. The time of injury occurrence is a required field only for level I and II EDs, and most records of level III ED patients do not include this information. However, as with other medical conditions, in cases of severe trauma, most patients are transferred to level I or II EDs and should be included in the collected data. Also, during the data extraction phase, regional trauma centers were coded as level I EDs.

DEMOGRAPHICS AND CHARACTERISTICS OF PATIENTS

The study focused on severe trauma patients who visited the ED over a period of 5 years, from 2018 to 2022. The total number of subjects was 367,410, with an mean±standard deviation (SD) age of 57.1±22.1 years. In total, 241,080 men (65.6%) and 126,330 women (34.4%) were included. Of these, 24,460 (6.7%) were younger than 17 years; 188,683 (51.4%) were aged 18 to 64 years; and 154,267 (42.0%) were 65 years or older. Men outnumbered women in all age groups, and the median time from injury to ED admission was 62 minutes. The primary mode of transportation was public emergency medical services (EMS) for 217,482 individuals (59.2%), followed by ambulation for 83,646 individuals (22.8%). However, among those younger than 17 years, ambulation to the ED was more frequent (14,245 individuals, 58.2%) than public EMS (7,911 individuals, 32.3%). The mean±SD duration of stay in the ED was 304.8±373.6 hours, with the highest percentage of pediatric patients (84.7%) staying for 6 hours or less. The most common outcome of ED treatment was admission, occurring in 263,788 individuals (71.8%) (Table 1).

FIVE-YEAR TRENDS OF ACUTE SEVERE TRAUMA

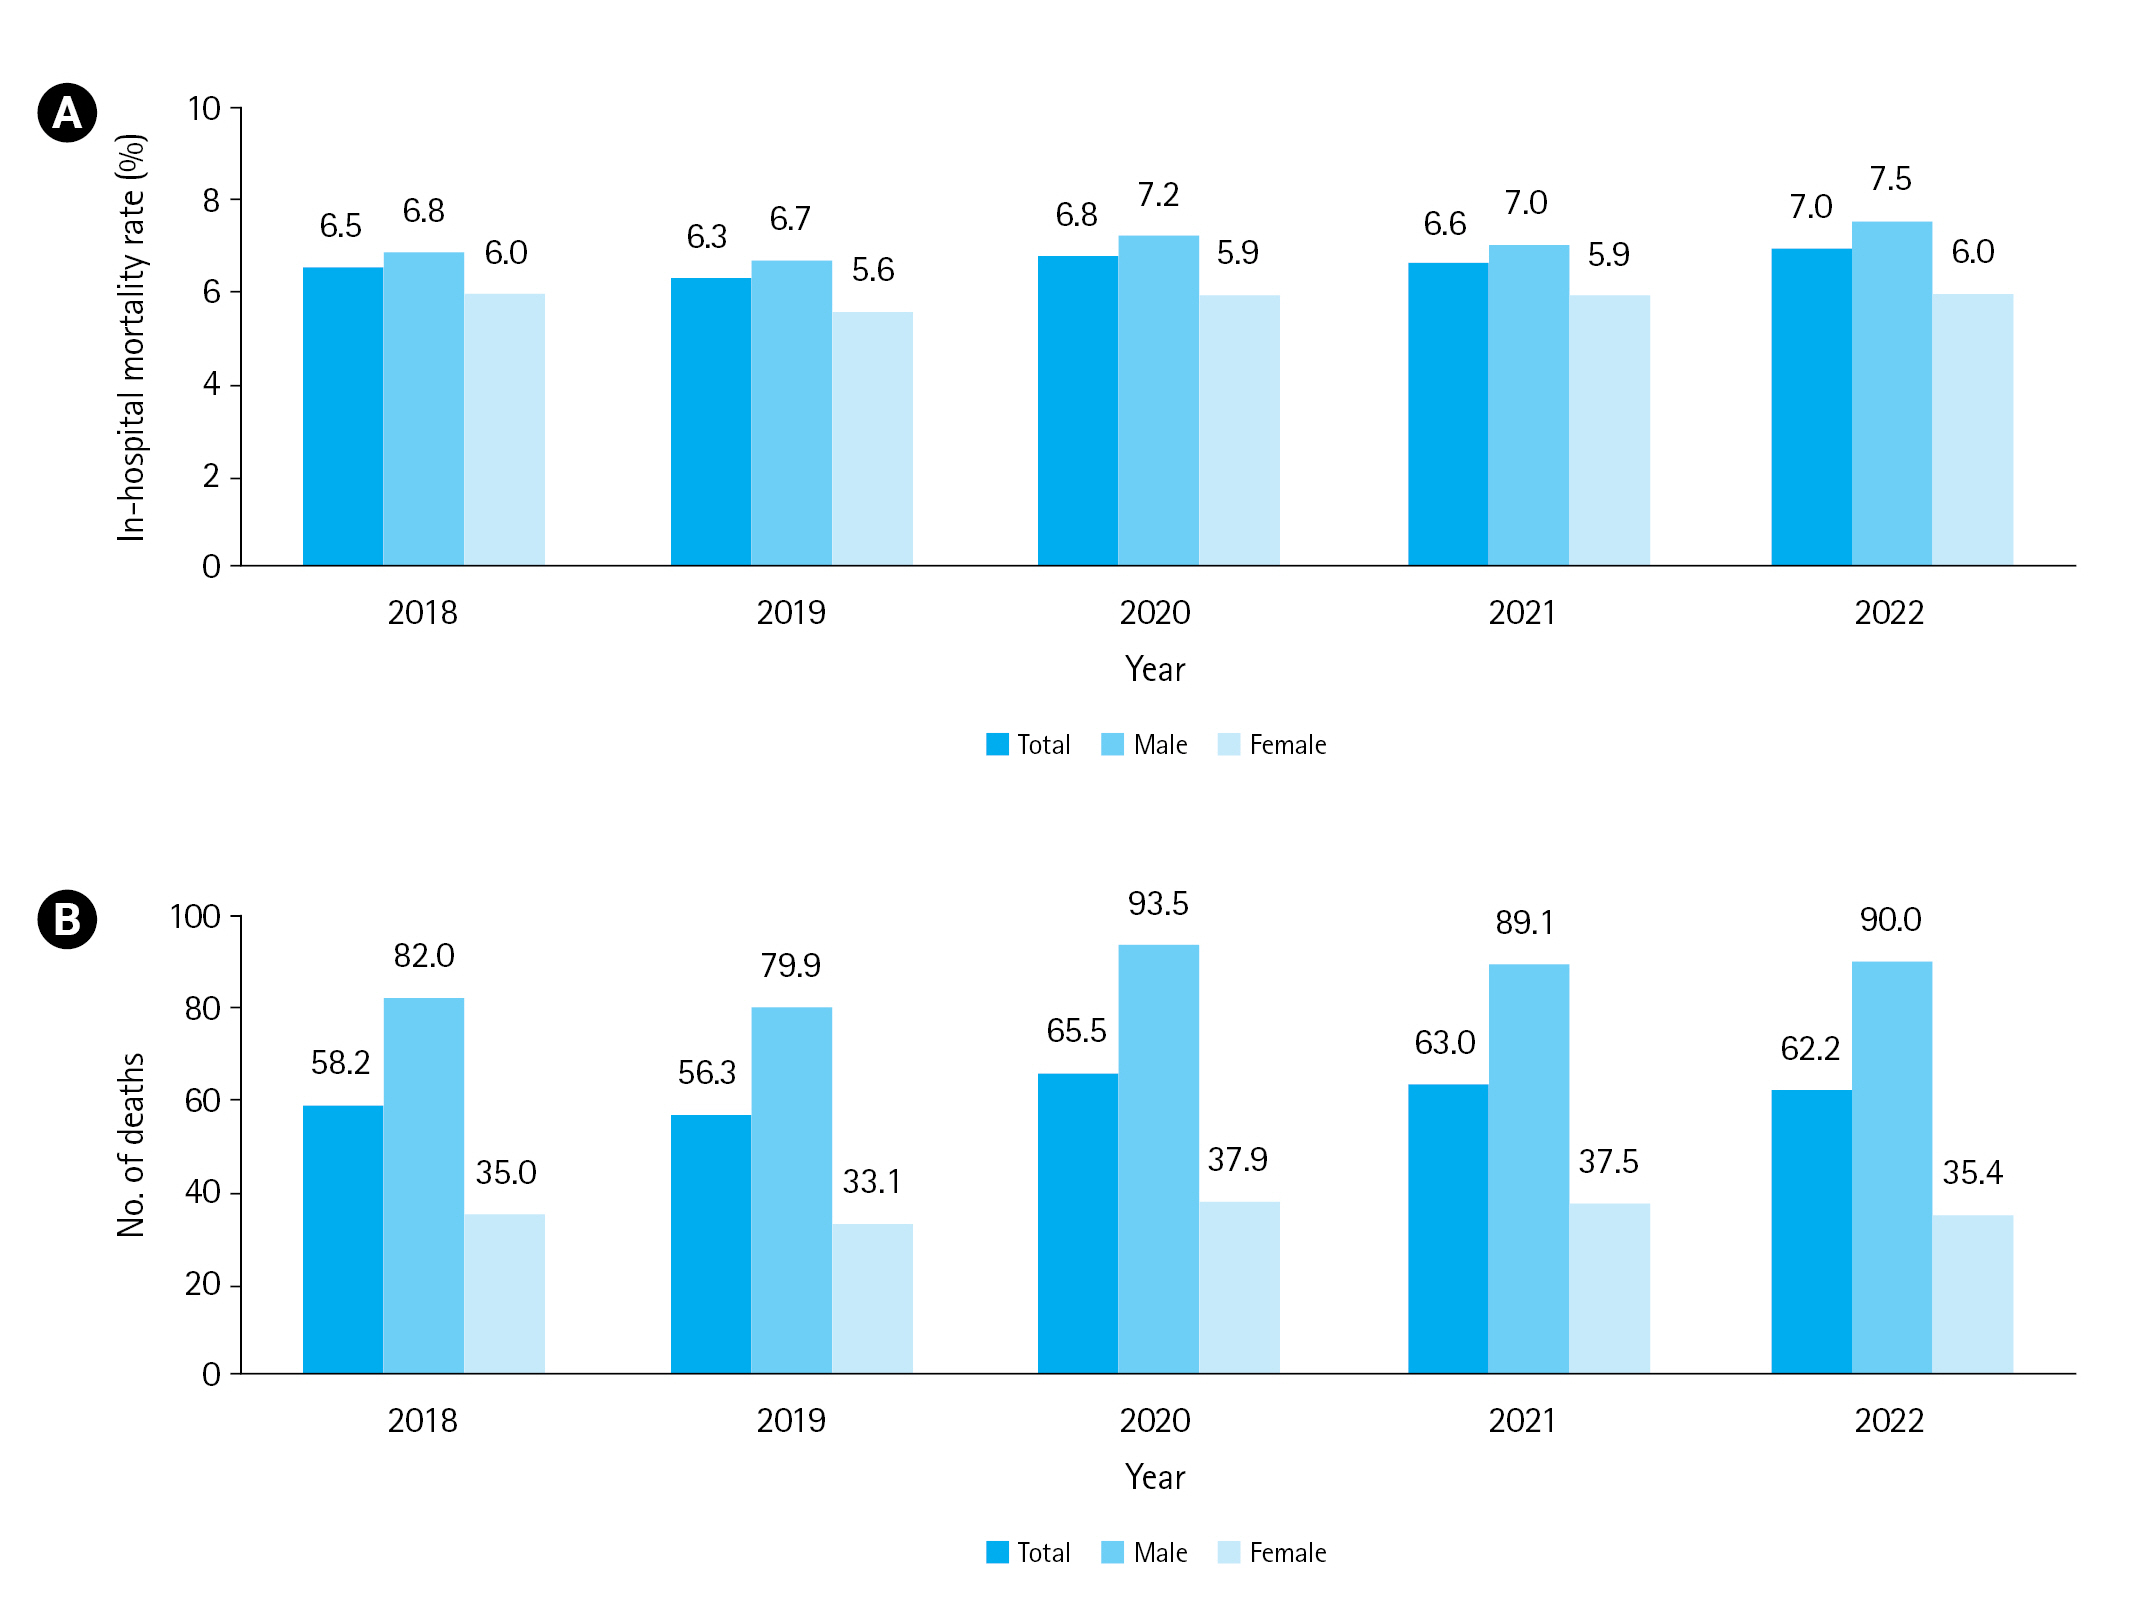
The respective incidence rate of severe trauma patients per 100,000 people from 2018 to 2022 was 155.1, 153.3, 135.3, 135.2, and 135.3 cases. Among them, men consistently exhibited a higher incidence rate, with respective values of 216.8, 213.5, 191.1, 187.0, and 186.5 (Fig. 1). The mortality rate varied by hospital, ranging from 6.3 to 7.0 deaths. Per 100,000 population, the mortality rate ranged from 58.2 to 65.5 deaths, with men consistently showing higher rates compared to women (Fig. 2). When categorized by ED type, the distribution among institution types was as follows: level I accounted for 162,091 individuals (44.1%), level II for 204,917 individuals (55.8%), and level III for 402 individuals (0.1%). Regarding the mode of arrival, direct visits were more common overall, and the percentage of transfer was slightly higher (28.8%) in level I EDs. In terms of transportation methods, level I EDs had a higher proportion of other or private ambulances compared to other types, while ambulatory transport was less common. The duration of stay in the ED was also longer in level I EDs (mean±SD, 321.8±390.1 minutes) compared to other institution types. The percentage of emergency admissions was higher in level I centers. Furthermore, overall discharge to other hospitals was also higher in level I centers compared to other institution types (Table 2).

DISCUSSION

This study examined the overall characteristics of severe trauma patients, including age- and institution-specific features, incidence rates, and mortality rates over the past 5 years (2018–2022). The incidence rate of severe trauma per 100,000 individuals ranged from 135.2 to 155.3, and the mortality rate ranged from 58.2 to 65.5. Among patients younger than 17 years, hospital transport modes differed from other groups, with a higher use of private vehicles (cars not ambulances or public cars). Pediatric patients also had shorter ED stays. At level I emergency centers, the route of arrival was often "transfer in," and patients had longer stays and more frequent admissions to the intensive care unit.
According to data reported by DiMaggio et al. [9] for the 7-year period from 2006 to 2017, the annual number of ED visits per 100,000 individuals for all trauma patients in the United States ranged from 8,115 to 8,923, showing a consistent decreasing trend. The average age in the study was 34.7 years, which is lower than the 57.1 years in our study. Although this study specifically focused on severe trauma patients, direct comparisons were challenging; there was a decreasing trend over the years. As shown in Fig. 1, the incidence rate per 100,000 individuals has been decreasing annually, likely influenced by reduced social activity during the COVID-19 pandemic [10]. During the COVID-19 pandemic, the standardized incidence of acute severe trauma patients decreased. However, it appears that the in-hospital and standardized mortality rates of acute severe trauma patients among those admitted to the ED have increased. While various injury prevention programs have succeeded in reducing the overall incidence of severe trauma, it seems that they have not been effective in preventing fatal trauma. Identifying risk factors for fatal trauma and improving prevention programs and trauma care systems should be the goal for reducing preventable mortality among trauma patients.
According to Sise et al. [11], injury-related mortality caused by motor vehicle accidents, falls, and firearms in the United States decreased from 32.2 to 30.5 deaths per 100,000 population from 2002 to 2010. In our study, over a 5-year period, there was an annual mortality rate of approximately 58.2 to 65.5 deaths per 100,000 individuals, with in-hospital mortality rates ranging from 6.3% to 7.0%.
Pediatric patients often used ambulatory transport to the ED, and their stays were shorter. In this study, the classification as "ambulatory" includes cases where individuals used other vehicles (e.g., private car) or walked in. This classification is solely based on the choice of the patient or guardian, and it does not reflect the severity of symptoms or whether the patient was mobile. This aligns with findings from Huh et al. [12], who observed a similar trend in pediatric patients, with a higher prevalence of "other vehicle" usage and increasing use of public EMS as patients transitioned into adulthood. Additionally, most pediatric patients were discharged rather than admitted, possibly due to the smaller stature of pediatric patients and a higher likelihood of mild injuries. In the United States, approximately 12 million children visit the ED annually for trauma-related reasons [13,14]. A study conducted in Japan [15], investigating the characteristics and mortality of pediatric patients due to traffic accidents, reported an overall hospital mortality rate of 3.9% and an ED mortality rate of 1.4%. These figures are similar to the 1.2% ED mortality rate observed in our study in pediatric patients.
Level I centers tend to have a higher proportion of "transfer in" severe patients, a greater number of admissions to the intensive care unit, higher mortality rates, and a higher rate of admissions after transfer out. Severely injured patients with an ISS >15 have significantly better survival outcomes when treated at level I trauma centers compared to level II trauma centers [1618].
In general, among trauma patients, men have a higher incidence rate and a higher mortality rate than women [12]. This is the same in pediatric patients. In a study by Aoki et al. [15], male injuries (69%) were more frequent than female injuries. Ivers [19] stated that application of epidemiological methods allows appropriate level and type of services can maximize treatment, reduce clinical complications, and ultimately lower the mortality rate.
This study had limitations. First, it focused on patients who experienced severe trauma. EDs also care for a significant number of mild and moderate trauma patients, and overcrowding and resource utilization have a substantial impact. Research that includes all levels of trauma, including those with mild and moderate injuries, would be valuable for effective operation of EDs. Second, we were unable to obtain data related to clinical symptoms and obtained limited information regarding diagnoses, specific injury locations, and surgical procedures.
In conclusion, the incidence rate of severe trauma per 100,000 individuals ranged from 135.2 to 155.3, while the mortality rate ranged from 58.2 to 65.5. Among patients younger than 17 years, hospital transport methods differed from other groups, with a higher use of private vehicles. Continuous monitoring and data analysis of epidemiological data are essential for trauma patients.

NOTES

Author contributions
Conceptualization: all authors; Data curation: WPH, YSR; Methodology: all authors; Project administration: YSR; Visualization: JYK, WPH; Writing–original draft: JYK; Writing–review & editing: all authors. All authors read and approved the final manuscript.
Conflicts of interest
The authors have no conflicts of interest to declare.
Funding
The authors received no financial support for this study.
Data availability
Data of this study are from the National Emergency Medical Center (NEMC; Seoul, Korea) under the Ministry of Health and Welfare of Korea, which were used under license for the current study. Although the data are not publicly accessible, they are available from the corresponding author upon reasonable request with permission from the NEMC.

REFERENCES

1. Prin M, Li G. Complications and in-hospital mortality in trauma patients treated in intensive care units in the United States, 2013. Inj Epidemiol 2016; 3:18.
crossref pmid pmc pdf
2. Rui P, Kang K. National Hospital Ambulatory Medical Care Survey: 2014 emergency department summary tables. Centers for Disease Control and Prevention (CDC); 2014.

3. Hokkam E, Gonna A, Zakaria O, El-Shemally A. Trauma patterns in patients attending the Emergency Department of Jazan General Hospital, Saudi Arabia. World J Emerg Med 2015; 6:48-53.
crossref pmid pmc
4. Kang J, Gong P, Zhang XD, Wang WJ, Li CS. Early differential value of plasma presepsin on infection of trauma patients. Shock 2019; 52:362-9.
crossref pmid
5. Rhee P, Joseph B, Pandit V, et al. Increasing trauma deaths in the United States. Ann Surg 2014; 260:13-21.
crossref pmid
6. Demetriades D, Kimbrell B, Salim A, et al. Trauma deaths in a mature urban trauma system: is “trimodal” distribution a valid concept? J Am Coll Surg 2005; 201:343-8.
crossref pmid
7. Yoon YH, Kim JY, Choi SH. Analysis of patients with acute toxic exposure between 2009 and 2013: data from the Korea Health Insurance Review and Assessment Service and the National Emergency Department Information System. J Korean Med Sci 2018; 33:e254.
crossref pmid pmc pdf
8. Kim S, Kang H, Cho Y, et al. Emergency department utilization and risk factors for mortality in older patients: an analysis of Korean National Emergency Department Information System data. Clin Exp Emerg Med 2021; 8:128-36.
crossref pmid pmc pdf
9. DiMaggio CJ, Avraham JB, Lee DC, Frangos SG, Wall SP. The epidemiology of emergency department trauma discharges in the United States. Acad Emerg Med 2017; 24:1244-56.
crossref pmid pmc pdf
10. Cho YS, Ro YS, Park JH, Moon S. Effect of social distancing on injury incidence during the COVID-19 pandemic: an interrupted time-series analysis. BMJ Open 2022; 12:e055296.
crossref pmid
11. Sise RG, Calvo RY, Spain DA, Weiser TG, Staudenmayer KL. The epidemiology of trauma-related mortality in the United States from 2002 to 2010. J Trauma Acute Care Surg 2014; 76:913-20.
crossref pmid
12. Huh KR, Kim JY, Choi SH, Yoon YH, Park SJ, Lee ES. Comparison of traumatic brain injury patients with brain computed tomography in the emergency department by age group. Clin Exp Emerg Med 2020; 7:81-6.
crossref pmid pmc pdf
13. Gindi RM, Jones LI. Reasons for emergency room use among U.S. children: National Health Interview Survey, 2012. NCHS Data Brief 2014; (160):1-8.

14. Roney L, Bautista-Durand M. Pediatric trauma. J Trauma Nurs 2019; 26:66.
crossref pmid
15. Aoki M, Abe T, Saitoh D, Oshima K. Epidemiology, patterns of treatment, and mortality of pediatric trauma patients in Japan. Sci Rep 2019; 9:917.
crossref pmid pmc pdf
16. DiRusso S, Holly C, Kamath R, et al. Preparation and achievement of American College of Surgeons level I trauma verification raises hospital performance and improves patient outcome. J Trauma 2001; 51:294-300.
crossref pmid
17. Brown JB, Watson GA, Forsythe RM, et al. American College of Surgeons trauma center verification versus state designation: are level II centers slipping through the cracks? J Trauma Acute Care Surg 2013; 75:44-9.
pmid pmc
18. Maggio PM, Brundage SI, Hernandez-Boussard T, Spain DA. Commitment to COT verification improves patient outcomes and financial performance. J Trauma 2009; 67:190-5.
crossref pmid
19. Ivers RQ. The role of epidemiology in improving the evidence base in injury prevention and trauma care. Injury 2012; 43:395-6.
crossref pmid

Fig. 1.
Age- and sex-standardized incidence rate per 100,000 population.
ceem-23-147f1.jpg
Fig. 2.
Mortality rate. (A) In-hospital mortality rate. (B) Age- and sex-standardized mortality rate per 100,000 emergency department visits
ceem-23-147f2.jpg
Table 1.
General demographics of patients with acute severe trauma (ICISS <0.9) by age groups
Variable Total Age group
Pediatric (0–17 yr) Adult (18–64 yr) Elderly (≥65 yr)
No. of patients 367,410 (100) 24,460 (6.7) 188,683 (51.4) 154,267 (42.0)
Age (mean±SD) (yr) 57.1±22.1 7.2±5.8 47.4±13.0 76.8±7.5
Sex
 Male 241,080 (65.6) 16,155 (66.0) 141,657 (75.1) 83,268 (54.0)
 Female 126,330 (34.4) 8,305 (34.0) 47,026 (24.9) 70,999 (46.0)
Time from onset to visita) (median [IQR]) (min) 62 (37–201) 60 (34–187) 60 (34–164) 79 (41–259)
Type of ED
 Level I 162,091 (44.1) 11,251 (46.0) 87,106 (46.2) 63,734 (41.3)
 Level II 204,917 (55.8) 13,191 (53.9) 101,347 (53.7) 90,379 (58.6)
 Level III 402 (0.1) 18 (0.1) 230 (0.1) 154 (0.1)
Route of arrival
 Direct visit 285,041 (77.6) 20,020 (81.8) 148,939 (78.9) 116,082 (75.2)
 Transfer from other hospital 80,246 (21.8) 4,328 (17.7) 38,969 (20.7) 36,949 (24.0)
 Referral from outpatient clinic 2,051 (0.6) 112 (0.5) 740 (0.4) 1,199 (0.8)
 Other 53 (0.0) 0 (0) 28 (0.0) 25 (0.0)
 Unknown 19 (0.0) 0 (0) 7 (0.0) 12 (0.0)
Mode of transport
 Public EMS 217,482 (59.2) 7,911 (32.3) 115,645 (61.3) 93,926 (60.9)
 Other hospital ambulance 12,422 (3.4) 509 (2.1) 5,816 (3.1) 6,097 (4.0)
 Private ambulance service 50,133 (13.6) 1,673 (6.8) 24,859 (13.2) 23,601 (15.3)
 Police or official transport 313 (0.1) 9 (0.0) 226 (0.1) 78 (0.1)
 Air transport 3,090 (0.8) 93 (0.4) 1,914 (1.0) 1,083 (0.7)
 Ambulatory 83,646 (22.8) 14,245 (58.2) 40,091 (21.2) 29,310 (19.0)
 Other or unknown 324 (0.1) 20 (0.1) 132 (0.1) 172 (0.1)
ED time
 Mean±SD (min) 304.8±373.6 226.1±244.0 292.8±356.1 331.9±407.5
 Median (IQR) (min) 195 (113–351) 159 (89–270) 186 (106–344) 213 (125–374)
 0–6 hr 278,512 (75.8) 20,726 (84.7) 144,362 (76.5) 113,424 (73.5)
 6–12 hr 58,841 (16.0) 2,657 (10.9) 29,732 (15.8) 26,452 (17.1)
 12–24 hr 23,896 (6.5) 963 (3.9) 11,957 (6.3) 10,976 (7.1)
 ≥24 hr 6,139 (1.7) 114 (0.5) 2,620 (1.4) 3,405 (2.2)
 Unknown 22 (0.0) 0 (0) 12 (0.0) 10 (0.0)
ED disposition
 Discharge 66,057 (18.0) 10,747 (43.9) 34,271 (18.2) 21,039 (13.6)
 Admissionb) 263,788 (71.8) 12,035 (49.2) 133,994 (71.0) 117,759 (76.3)
  General wardc) 148,919 (56.5) 8,056 (66.9) 72,876 (54.4) 67,987 (57.7)
  Intensive care unitc) 114,761 (43.5) 3,977 (33.0) 61,081 (45.6) 49,703 (42.2)
 Transfer out 29,199 (7.9) 1,368 (5.6) 15,637 (8.3) 12,194 (7.9)
 Hopeless discharge 141 (0.0) 0 (0) 22 (0.0) 119 (0.1)
 Death 7,785 (2.1) 296 (1.2) 4,472 (2.4) 3,017 (2.0)
 Other or unknown 440 (0.1) 14 (0.1) 287 (0.1) 139 (0.1)
Hospital disposition
 Discharge 240,563 (65.5) 21,116 (86.3) 125,241 (66.4) 94,206 (61.1)
 Transfer out 98,713 (26.9) 2,634 (10.8) 51,071 (27.1) 45,008 (29.2)
 Hopeless discharge 273 (0.1) 2 (0.0) 63 (0.0) 208 (0.1)
 Death 24,100 (6.6) 549 (2.2) 10,437 (5.5) 13,114 (8.5)
 Other or unknown 3,761 (1.0) 159 (0.7) 1,871 (1.0) 1,731 (1.1)
Mechanism of injuryd)
 Traffic accident 378 (0.2) 19 (0.1) 328 (0.2) 31 (0.1)
 Fall 4,389 (2.1) 653 (3.4) 3,293 (2.0) 443 (1.9)
 Slip down 285 (0.1) 19 (0.1) 167 (0.1) 99 (0.4)
 Blunt trauma 6,275 (3.0) 693 (3.6) 5,324 (3.2) 258 (1.1)
 Cut or stab 47,890 (23.2) 5,780 (30.0) 40,437 (24.7) 1,673 (7.2)
 Machinery 27 (0.0) 0 (0) 22 (0.0) 5 (0.0)
 Burn 297 (0.1) 16 (0.1) 261 (0.2) 20 (0.1)
 Drowning 1,725 (0.8) 107 (0.6) 1,454 (0.9) 164 (0.7)
 Poisoning 106,449 (51.6) 7,685 (39.9) 82,265 (50.2) 16,499 (71.0)
 Asphyxiation 9,274 (4.5) 263 (1.4) 7,380 (4.5) 1,631 (7.0)
 Other 5,129 (2.5) 575 (3.0) 4,132 (2.5) 422 (1.8)
 Unknowne) 24,291 (11.8) 3,473 (18.0) 18,833 (11.5) 1,985 (8.5)

Values are presented as number (%), unless otherwise indicated. Percentages may not total 100 due to rounding.

ICISS, International Classification of Diseases–based Injury Severity Score (2020 criteria); SD, standard deviation; IQR, interquartile range; ED, emergency department; EMS, emergency medical services.

a) The onset date and time is a field transmitted only by level I and II EDs.

b) Data for the “other” category are not presented.

c) Proportion among total admissions.

d) Reported when the disease status is “excluded from disease” by level I and II EDs.

e) The sum of cases where the mechanism of injury is unknown or unspecified when the disease status is “disease” or “disease excluded,” and when the disease status is “unknown or not specified.”

Table 2.
Demographics of patients with acute severe trauma (ICISS <0.9) by emergency institutions
Variable Total Type of ED
Level I Level II Level III
No. of patients 367,410 (100) 162,091 (44.1) 204,917 (55.8) 402 (0.1)
Age (mean±SD) (yr) 57.1±22.1 55.8±22.0 58.1±22.1 58.2±19.3
Sex
 Male 241,080 (65.6) 110,716 (68.3) 130,084 (63.5) 280 (69.7)
 Female 126,330 (34.4) 51,375 (31.7) 74,833 (36.5) 122 (30.3)
Time from onset to visita) (median [IQR]) (min) 62 (37–201) 72 (43–205) 60 (33–197) 53 (30–195)
Route of arrival
 Direct visit 285,041 (77.6) 114,470 (70.6) 170,238 (83.1) 333 (82.8)
 Transfer from other hospital 80,246 (21.8) 46,683 (28.8) 33,497 (16.3) 66 (16.4)
 Referral from outpatient clinic 2,051 (0.6) 906 (0.6) 1,142 (0.6) 3 (0.7)
 Other 53 (0.0) 22 (0.0) 31 (0.0) 0 (0)
 Unknown 19 (0.0) 10 (0.0) 9 (0.0) 0 (0)
Mode of transport
 Public EMS 217,482 (59.2) 93,007 (57.4) 124,230 (60.6) 245 (60.9)
 Other hospital ambulance 12,422 (3.4) 8,665 (5.3) 3,750 (1.8) 7 (1.7)
 Private ambulance service 50,133 (13.6) 28,138 (17.4) 21,950 (10.7) 45 (11.2)
 Police or official transport 313 (0.1) 122 (0.1) 191 (0.1) 0 (0)
 Air transport 3,090 (0.8) 2,914 (1.8) 176 (0.1) 0 (0)
 Ambulatory 83,646 (22.8) 29,105 (18.0) 54,436 (26.6) 105 (23.1)
 Other or unknown 324 (0.1) 140 (0.1) 184 (0.1) 0 (0)
ED time
 Mean±SD 304.8±373.6 321.8±390.1 291.5±359.7 212.2±232.3
 Median (IQR) 195 (113–351) 212 (118–377) 184 (109–331) 135.5 (88–225.5)
 0–6 hr 278,512 (75.8) 118,783 (73.3) 159,387 (77.8) 342 (85.1)
 6–12 hr 58,841 (16.0) 28,905 (17.8) 29,894 (14.6) 42 (10.4)
 12–24 hr 23,896 (6.5) 11,388 (7.0) 12,491 (6.1) 17 (4.2)
 ≥24 hr 6,139 (1.7) 2,999 (1.9) 3,139 (1.5) 1 (0.2)
 Unknown 22 (0.0) 16 (0.0) 6 (0.0) 0 (0)
ED disposition
 Discharge 66,057 (18.0) 25,514 (15.7) 40,503 (19.8) 40 (10.0)
 Admissionb) 263,788 (71.8) 122,917 (75.8) 140,566 (68.6) 305 (75.9)
  General wardc) 148,919 (56.5) 56,885 (46.3) 91,818 (65.3) 216 (70.8)
  Intensive care unitc) 114,761 (43.5) 65,987 (53.7) 48,685 (34.6) 89 (29.2)
 Transfer out 29,199 (7.9) 8,668 (5.3) 20,479 (10.0) 52 (12.9)
 Hopeless discharge 141 (0.0) 132 (0.1) 9 (0.0) 0 (0)
 Death 7,785 (2.1) 4,762 (2.9) 3,018 (1.5) 5 (1.2)
 Other or unknown 440 (0.1) 98 (0.1) 342 (0.2) 0 (0)
Hospital disposition
 Discharge 240,563 (65.5) 96,791 (59.7) 143,494 (70.0) 278 (69.2)
 Transfer out 98,713 (26.9) 49,807 (30.7) 48,807 (23.8) 99 (24.6)
 Hopeless discharge 273 (0.1) 216 (0.1) 56 (0.0) 1 (0.2)
 Death 24,100 (6.6) 13,402 (8.3) 10,685 (5.2) 13 (3.2)
 Other or unknown 3,761 (1.0) 1,875 (1.2) 1,875 (0.9) 11 (2.7)
Mechanism of injuryd)
 Traffic accident 378 (0.2) 144 (0.2) 234 (0.2) 0 (0)
 Fall 4,389 (2.1) 2,241 (2.6) 2,145 (1.9) 3 (0.0)
 Slip down 285 (0.1) 68 (0.1) 217 (0.2) 0 (0)
 Blunt trauma 6,275 (3.0) 1,629 (1.9) 4,641 (4.0) 5 (0.1)
 Cut or stab 47,890 (23.2) 17,475 (20.6) 30,380 (26.3) 35 (0.6)
 Machinery 27 (0.0) 11 (0.0) 16 (0.0) 0 (0)
 Burn 297 (0.1) 152 (0.2) 145 (0.1) 0 (0)
 Drowning 1,725 (0.8) 501 (0.6) 1,223 (1.1) 1 (0.0)
 Poisoning 106,449 (51.6) 48,771 (57.5) 57,626 (49.9) 52 (0.8)
 Asphyxiation 9,274 (4.5) 3,829 (4.5) 5,437 (4.7) 8 (0.1)
 Other 5,129 (2.5) 2,020 (2.4) 3,107 (2.7) 2 (0.0)
 Unknowne) 24,291 (11.8) 7,966 (9.4) 10,209 (8.8) 6,116 (98.3)

Values are presented as number (%), unless otherwise indicated. Percentages may not total 100 due to rounding.

ICISS, International Classification of Diseases–based Injury Severity Score (2020 criteria); ED, emergency department; SD, standard deviation; IQR, interquartile range; EMS, emergency medical services.

a) The onset date and time is a field transmitted only by level I and II EDs.

b) Data for the “other” category are not presented.

c) Proportion among total admissions.

d) Reported when the disease status is “excluded from disease” by level I and II EDs.

e) The sum of cases where the mechanism of injury is unknown or unspecified when the disease status is “disease” or “disease excluded,” and when the disease status is “unknown or not specified.”

Editorial Office
The Korean Society of Emergency Medicine
101-3104, Brownstone Seoul, 464 Cheongpa-ro, Jung-gu, Seoul 04510, Korea
TEL: +82-31-709-0918   E-mail: office@ceemjournal.org
About |  Browse Articles |  Current Issue |  For Authors and Reviewers
Copyright © by The Korean Society of Emergency Medicine.                 Developed in M2PI