Lim, Jo, Kim, Ko, Ro, Kim, and Baek: Emergency department utilization in elderly patients: a report from the National Emergency Department Information System (NEDIS) of Korea, 2018-2022
1Department of Emergency Medicine, Seoul National University Bundang Hospital, Seongnam, Korea
2Department of Emergency Medicine, Seoul National University College of Medicine, Seoul, Korea
3Disaster Medicine Research Center, Seoul National University Medical Research Center, Seoul, Korea
4National Emergency Medical Center, National Medical Center, Seoul, Korea
5Department of Emergency Medicine, Chosun University Hospital, Gwangju, Korea
6Department of Emergency Medicine, Seoul National University Hospital, Seoul, Korea
Correspondence to: Sumin Baek Department of Emergency Medicine, Seoul National University Bundang Hospital, 82 Gumi-ro 173beon-gil, Bundang-gu, Seongnam 13620, Korea Email: pueril0408@gmail.com
Co-correspondence to: Young Sun Ro Department of Emergency Medicine, Seoul National University Hospital, 101 Daehak-ro, Jongno-gu, Seoul 03080, Korea Email: Ro.youngsun@gmail.com
Received: October 4, 2023 Accepted: October 11, 2023
With general aging of the population, emergency department (ED) utilization by elderly patients is increasing. In this study, we analyzed data on ED visits of patients aged 65 years and older in Korea.
Methods
The study is a retrospective analysis of National Emergency Department Information System (NEDIS) data from 2018–2022, focusing on patients aged 65 years and older who visited EDs across Korea. ED utilization data were analyzed using Korean Triage and Acuity Scale (KTAS) scores. The patients were divided into three age groups, and common chief complaints and diagnoses were identified. Age- and sex-standardized ED visits per 100,000 population and outcomes were also analyzed.
Results
During the study period, there was a total of 9,803,065 elderly patient ED visits. The mean patient age was 76.4±7.6 years, and 47.6% were men. The ED mortality rate and in-hospital mortality rate were 1.8% and 4.6%, respectively. The KTAS scores 1–2 group accounted for 11.0% of patients, KTAS score 3 group for 42.5%, KTAS scores 4–5 group for 37.2%, and KTAS score unknown group for 9.4%. When patients were categorized into three age groups, the oldest group exhibited the highest rates of KTAS score 1, severe illness diagnoses, and mortality. The most frequently reported chief complaint was abdominal pain, and the most common diagnosis was light headedness. When analyzing the data by year, the COVID-19 outbreak had a discernible impact on ED visits and clinical outcomes.
Conclusion
Over the past 5 years, ED visits for elderly patients have averaged 26,050 per 100,000 population per year, with a temporary decline during the COVID-19 pandemic and a subsequent upward trend.
As the aging population continues to grow, there has been an increase in the utilization of emergency departments by elderly patients.
What is new in the current study
National emergency department data from Korea were analyzed to determine emergency department utilization and visits, in-hospital mortality, hospitalization rates, transfer rates, chief complaints, and diagnoses for patients aged 65 years and older. This analysis is anticipated to serve as a reference for emergency medical system policies for the aging population.
INTRODUCTION
According to the census, 9.4 million elderly population aged 65 years and older reside in Korea in 2023, accounting for 18.4% of the total population, and experts expect that elderly citizens will account for 28.1% of the total population in 10 years [1]. This increase in the elderly population is global; as the elderly population increases, use of healthcare resources, including use of emergency departments (EDs), by elderly patients increases [2–4].
It has been reported that ED utilization by older patients has different characteristics than that of younger patients. Compared to younger patients, older patients visit the ED more frequently and are more likely to be transported by ambulance [2]. Older patients also have more frequent comorbidities and complex physiologic changes. They spend more time in the ED and undergo a larger number of diagnostic tests than younger patients [5]. Their rate of hospitalization after ED care is higher, and their rate of intensive care unit (ICU) admission is higher than that [4,5]. Older patients discharged from the ED are more likely to return to the ED than are such younger patients [6].
EDs play an important role in providing acute care for older patients and acting as a pathway for subsequent outpatient facility use or hospitalization [5]. Proper treatment and disposition in the ED allow efficient distribution of healthcare resources by reducing delays in acute care and unnecessary hospitalizations [5]. The importance of the ED in geriatric care continues to be emphasized and has led to the birth of geriatric EDs [7]. The ED is also an integral part of geriatric care by providing patients with not only medical care, but also linkages to palliative care and social services [5,8].
To provide more effective and efficient emergency medical care to the elderly, who often present with complex needs, it is crucial to understand ED utilization behavior. We aimed to identify the epidemiologic characteristics and trends of elderly patients attending EDs in Korea and to examine their age-specific characteristics and treatment outcomes.
METHODS
Ethics statement
The study was approved by the Institutional Review Board of the National Medical Center of Korea (No. NMC-2023-08-094). The requirement for informed consent was waived due to the retrospective nature of the study.
Study design and population
This study is a retrospective analysis of National Emergency Department Information System (NEDIS) data for patients aged 65 years and older who presented to EDs nationwide from 2018 to 2022.
Data source and measurements
The NEDIS database was established in 2003 to measure the quality of emergency care and to provide a basis for the development of national and federal emergency care policies. Data from NEDIS, collected in real-time from 402 EDs nationwide, include demographic information such as sex, age, and insurance source; symptoms including chief complaints and time of onset; prehospitalization information such as emergency medical service usage and treatment and mode of transport; ED hospital information including level of consciousness upon arrival, emergency surgical procedures performed, need for intensive care, duration of hospital stay after admission, and final clinical outcomes; and Korean Triage and Acuity Scale (KTAS) scores. KTAS scores range from 1 to 5, with 1 being the most severe and 5 being the least severe [9]. For data quality management, approval for NEDIS data must be obtained from Statistics Korea (Daejeon, Korea) annually. The National Emergency Medical Center (NEMC; Seoul, Korea), an administrative agency under the Ministry of Health and Welfare of Korea, is designated as the NEDIS data management organization according to Article 25 of the Emergency Medical Services Act [10].
We extracted the following patient and ED visit data: age, sex, time from symptom onset to visit, day of visit (weekday vs. weekend or holiday), time of visit, level of center providing care, disease category, insurance type, route to the ED, transportation mode to ED visits, initial KTAS score, final KTAS score at discharge, severe illness diagnosis codes [11], length of stay in the ED, and ED outcome (discharge, admission, transfer, hopeless discharge, death, other, or unknown) and hospitalization outcomes (discharge, transfer, hopeless discharge, death, other, or unknown).
Statistical analysis
All eligible patients from 2018 to 2022 were categorized into three groups according to the final KTAS score and three age groups: 65–74, 75–84, and 85–130 years. Patient demographics, ED visit information, and hospital outcome were measured for KTAS score and age groups. The 15 most common chief complaints upon ED visit and the 15 most common diagnoses at ED discharge during the study periods were extracted and analyzed in terms of number and percentage of total patients. Other calculations were age- and sex-standardized ED visits per 100,000 population by year; age- and sex-standardized mortality rate; and hospital admissions and transfers to other hospitals by year and sex were also calculated. The age- and sex-standardized ED visits per 1,000 population were calculated using the census population in the Korean Statistical Information Service (KOSIS) database from Statistics Korea (Daejeon, Korea).
Demographic attributes and features of EDs are summarized using descriptive statistics. Normally distributed variables are presented as the average and standard deviation, while those not following a normal distribution are depicted using the median and interquartile range. Data for categorical variables are shown as number counts and their respective percentages within the entire dataset.
RESULTS
During the study period, there were a total of 9,803,065 ED visits by elderly patients. Of these patients, the mean age was 76.4±7.6 years, and 47.6% were male (Table 1). Approximately 75% of patients visited the EDs due to disease, 13.2% were transferred from other hospitals, and 39.6% of patients were transported by ambulance. The mean ED length of stay was 269.1±425.5 minutes, 36.1% of patients were hospitalized, and 18.3% of the hospitalized patients were admitted to the ICU. The ED mortality rate and in-hospital mortality rate were 1.8% and 4.6%, respectively.
When patients are categorized according to final KTAS scores, KTAS scores 1–2 patients accounted for 11.0%, KTAS score 3 patients for 42.5%, KTAS scores 4–5 patients for 37.2%, and KTAS score unknown patients for 9.4% (Table 1). The KTAS scores 1–2 group consisted of a higher proportion of the oldest age group (85–130 years), and a higher proportion of men compared to those with KTAS scores 3 or 4–5. Time from symptom onset to ED visit showed a tendency to be shorter in KTAS scores 1–2 patients. Patients in KTAS scores 4–5 were more likely to visit level III centers compared to other groups. Over 85% of patients in KTAS scores 1–2 and 3 visited for disease, while 29.4% of patients in KTAS scores 4–5 visited for injuries such as those from accidents, suicide attempts, and violence. A total of 85.4% of patients had National Health Insurance and 10.3% had medical aid. The KTAS scores 4–5 patients visited the EDs directly more often than being transferred from other hospitals, and their rate of ambulance transfer was low. Initial triage indicated that 8.5% of patients had KTAS scores of 3 or 4–5 that changed to KTAS scores 1–2; 51.9% of patients with KTAS scores of 1–2 had severe illness diagnosis codes. ED length of stay tended to be longer with higher severity, which was associated with higher rates of ICU admissions and ED and in-hospital mortality.
Table 2 shows the descriptive characteristics of patients by age group; 44.2% were 65–74 years, 39.7% were 75–84 years, and 16.1% were 85–130 years. The oldest group (aged 85–130 years) had highest rates of female patients (64.5%), patients transferred from other hospitals (16.1%), patients transported to the EDs by ambulance (53.0%), patients with severity categorized as KTAS score 1 (4.9%), and patients with severe illness diagnoses (27.1%). This oldest age group also had highest rates of hospitalization (45.1%) and ED mortality (3.9%) and in-hospital mortality (9.0%).
The three most common chief presenting complaints were abdominal pain, dyspnea, and dizziness; these accounted for about 21.8% of ED visits. The three most common diagnoses upon discharge from the ED were light headedness (R42), gastroenteritis (A099), and pneumonia (J189), accounting for about 9.7% of visits (Table 3). During the study period, the COVID-19 pandemic occurred; related diagnoses such as COVID-19 and special screening examinations for other viral diseases accounted for 1.7% of ED visits.
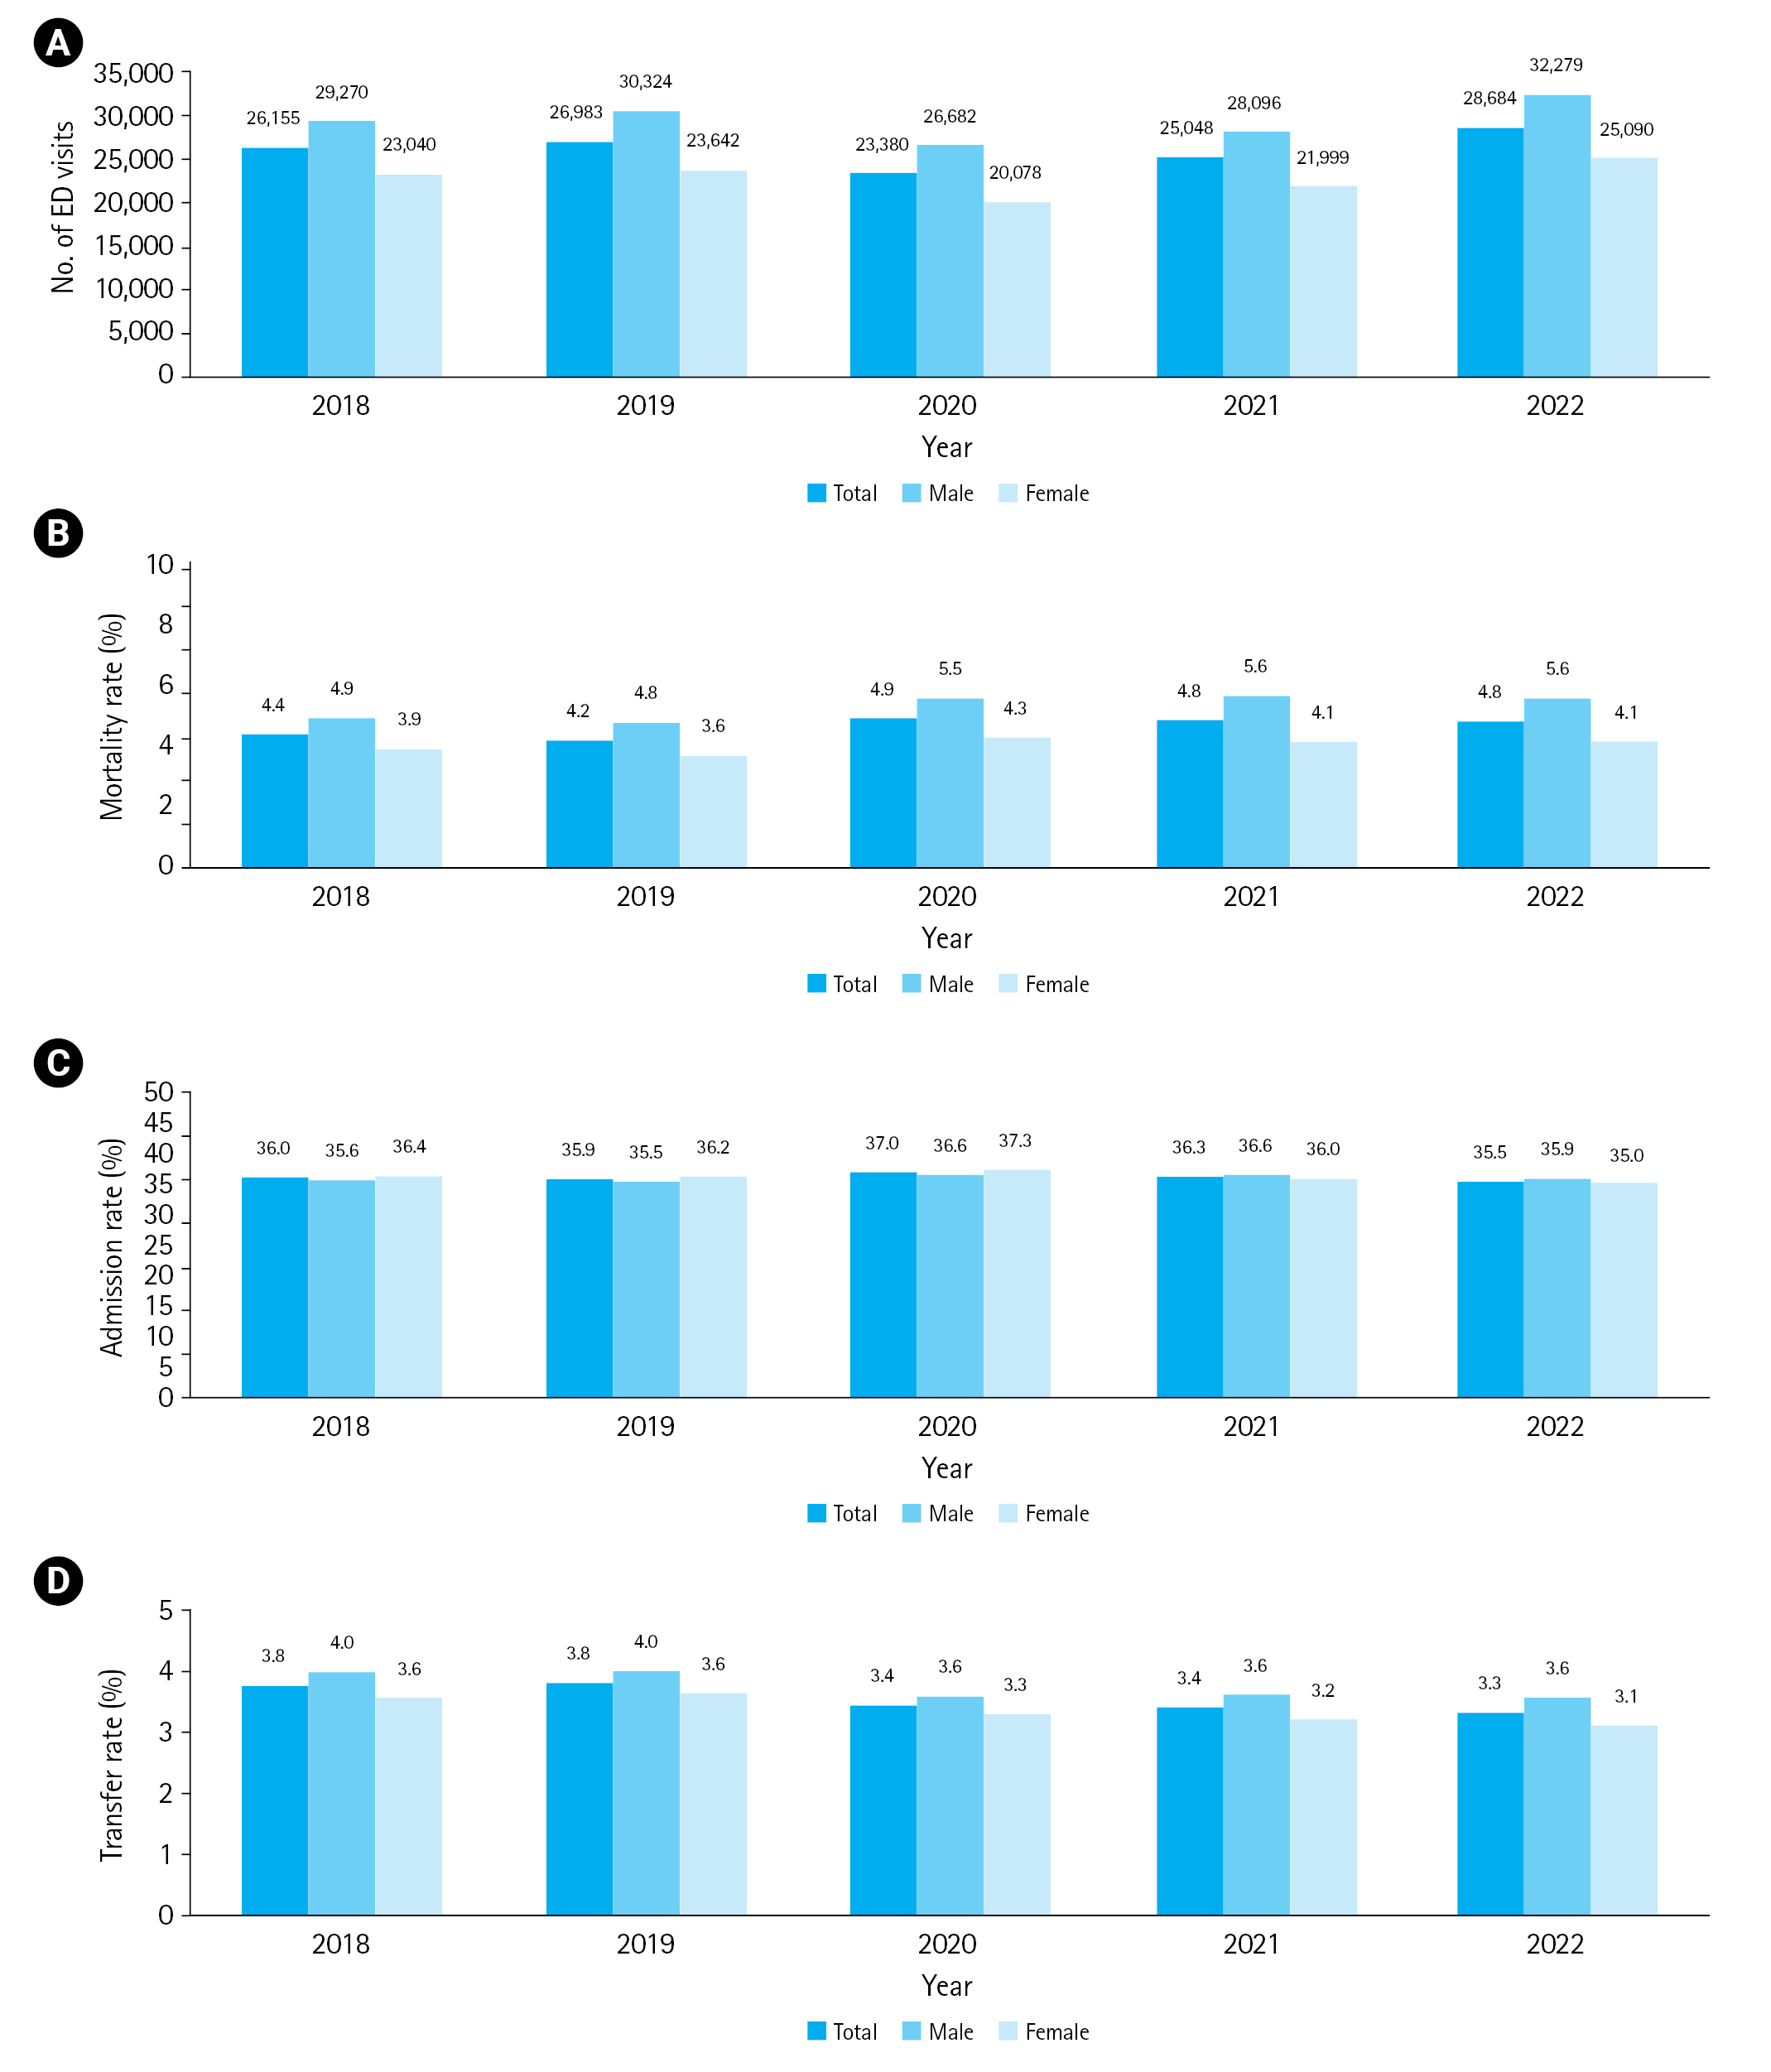
Fig. 1A shows age- and sex-standardized ED visits per 100,000 population from 2018 to 2022. ED visits increased in 2019 compared to 2018, decreased in 2020 when the COVID-10 outbreak occurred, and increased again thereafter. The changes were similar for male and female patients. Age- and sex-standardized mortality rate decreased from 4.4% overall in 2018 to 4.2% in 2019, then increased to 4.9% in 2020 and remained at 4.8% in 2021 and 2022 (Fig. 1B). Male patients had a higher mortality rate than female patients during the study period, and the mortality rate for male patients increased from 5.5% to 5.6%. The mortality rate of the female patients decreased after 2020. The hospital admission rate increased in 2020 and then decreased in 2021 and in 2022 (Fig. 1C). The overall rate of transfers decreased in 2020 compared to 2019, and the percentage of female patients continued to decrease after 2020 (Fig. 1D).
DISCUSSION
This study used a nationwide emergency patient database and evaluated the epidemiologic trends of geriatric ED visits. Over the studied 5-year period, patients aged 65 years and older had an annual average of 26,050 ED visits per 100,000 population; 4.6% died in the hospital; 36.1% were hospitalized; and 3.6% were transferred. Several considerations were affected by advancing age. The proportion of female patients, the number of hospital transfers, the number of ambulance transports, presenting condition severity, and ED and in-hospital mortality rates increased. The results from our study can serve as a basis for developing and improving health care delivery policies, especially in the context of a rapidly growing elderly population.
Our primary focus was comprehensive investigation of the utilization patterns of EDs by individuals aged 65 years and older, drawing from a robust dataset derived from national ED visits in Korea. Our investigation sought to discern and elucidate noteworthy distinctions in the emergency care access of elderly patients, variations in their lengths of ED and in-hospital stay, and disparities in the rates of hospitalization based on the severity of their medical conditions. In addition, we investigated the epidemiological characteristics that evolve with advancing age in this demographic group.
This study has elucidated that the proportions of female patients and hospitalizations, in-hospital mortality, the rate of transfers from other hospitals, the frequency of ED visits via ambulance services, and the rate of transfer to hospitals all have a positive correlation with advancing age. Such a pattern is consistent with the findings of a prior study conducted by Lee et al. [12]. The increasing representation of female patients across age cohorts is probably due to increased life expectancy among this demographic, and the increasing rates of hospitalization and in-hospital mortality are likely multifactorial. These stem from interactions of complex variables such as underlying medical conditions and the physiological decline of organ systems associated with the aging process. The tendency for the proportion of ED visits by ambulance or transfer from another hospital to increase with age may be attributed to the heightened likelihood that the older patient is or was receiving inpatient care. Reduced mobility and the associated severity of intrinsic medical conditions are also viable explanations for these findings. The increasing rate of hospital transfers with increasing age suggests the persistent medical requirements after hospital discharge.
The increase in ED length of stay with age has been reported in several studies [13,14]. In the present study, we also observed a trend toward longer ED stays with increasing age. This trend could be ascribed to the higher severity of illnesses experienced by elderly patients that necessitates comprehensive diagnostic tests, consultations with multiple medical specialists, and additional interventions.
The study period in the present study coincided with the COVID-19 outbreak [15]. The discernible decrease observed in age-standardized ED visits per 100,000 population in 2020, as shown in Fig. 1A, can reasonably be attributed to substantial alterations within the emergency medical system prompted by the pandemic and to changes in ED visit patterns. As the COVID-19 pandemic continued to escalate in severity, the delivery of emergency medical services was significantly disrupted. Instances of temporary ED closures were increasingly prevalent due to confirmed cases of the virus within ED facilities. Furthermore, 57 EDs were designated as specialized infectious disease treatment centers. These institutional adjustments culminated in a comprehensive overhaul of emergency medical care policies necessitated by the need to address the unique challenges and demands posed by the pandemic [10].
In-hospital mortality rates were also impacted by COVID-19, increasing from 4.2% in 2019 to 4.9% in 2020. The same trend was reported by Jung et al. [16], who found an increase in in-hospital mortality from before COVID-19 to after COVID-19. This is likely due to the severity of COVID-19 and the changes in the emergency medical system described above.
There are several limitations to this study. First, KTAS scores were not recorded for approximately 10% of patients. Level III centers were not required to send KTAS data to NEDIS until 2021, so information is missing prior to that. However, given the age and sex distributions and the insurance type data, the missing KTAS score information probably did not affect the overall results. Second, this study is a retrospective analysis of large-scale data that may not be an accurate representation of clinical experience. The NEDIS database is composed of computerized medical records that are automatically transmitted. If the medical records are not filled out accurately, actual clinical information may be altered. However, since these data are a compilation of all data from EDs across the country, we believe that errors in the information are likely to be minimal.
Over the past 5 years, the number of geriatric patients presenting to EDs temporarily declined due to the COVID-19 pandemic but has since rebounded and is expected to continue to grow. We expect that the present study will help inform and guide the development of customized strategies and interventions to respond to the needs and challenges of providing emergency medical care to elderly patients.
NOTES
Author contributions
Conceptualization: all authors; Data curation: YSR, JK; Methodology: all authors; Project administration: YSR; Visualization: SYL, JK; Writing–original draft: SYL; Writing–review & editing: all authors. All authors read and approved the final manuscript.
Conflicts of interest
The authors have no conflicts of interest to declare.
Funding
The authors received no financial support for this study.
Data availability
Data of this study are from the National Emergency Medical Center (NEMC; Seoul, Korea) under the Ministry of Health and Welfare of Korea, which were used under license for the current study. Although the data are not publicly accessible, they are available from the corresponding author upon reasonable request with permission from the NEMC.
2. Strange GR, Chen EH, Sanders AB. Use of emergency departments by elderly patients: projections from a multicenter data base. Ann Emerg Med 1992; 21:819-24.
3. Pines JM, Mullins PM, Cooper JK, Feng LB, Roth KE. National trends in emergency department use, care patterns, and quality of care of older adults in the United States. J Am Geriatr Soc 2013; 61:12-7.
4. Magidson PD, Carpenter CR. Trends in geriatric emergency medicine. Emerg Med Clin North Am 2021; 39:243-55.
5. American College of Emergency Physicians; American Geriatrics Society; Emergency Nurses Association; Society for Academic Emergency Medicine; Geriatric Emergency Department Guidelines Task Force. Geriatric emergency department guidelines. Ann Emerg Med 2014; 63:e7-25.
6. Martin-Gill C, Reiser RC. Risk factors for 72-hour admission to the ED. Am J Emerg Med 2004; 22:448-53.
7. Shadyab AH, Castillo EM, Chan TC, Tolia VM. Developing and implementing a geriatric emergency department (GED): overview and characteristics of GED visits. J Emerg Med 2021; 61:131-9.
8. Chang A, Espinosa J, Lucerna A, Parikh N. Palliative and end-of-life care in the emergency department. Clin Exp Emerg Med 2022; 9:253-6.
9. Kim S, Kang H, Cho Y, et al. Emergency department utilization and risk factors for mortality in older patients: an analysis of Korean National Emergency Department Information System data. Clin Exp Emerg Med 2021; 8:128-36.
10. Pak YS, Ro YS, Kim SH, et al. Effects of emergency care-related health policies during the COVID-19 pandemic in Korea: a quasi-experimental study. J Korean Med Sci 2021; 36:e121.
11. Baek SM, Seo DW, Kim YJ, et al. Analysis of emergency department length of stay in patient with severe illness code. J Korean Soc Emerg Med 2020; 31:518-25.
12. Lee SB, Oh JH, Park JH, Choi SP, Wee JH. Differences in youngest-old, middle-old, and oldest-old patients who visit the emergency department. Clin Exp Emerg Med 2018; 5:249-55.
13. Biber R, Bail HJ, Sieber C, Weis P, Christ M, Singler K. Correlation between age, emergency department length of stay and hospital admission rate in emergency department patients aged ≥70 years. Gerontology 2013; 59:17-22.
14. Latham LP, Ackroyd-Stolarz S. Emergency department utilization by older adults: a descriptive study. Can Geriatr J 2014; 17:118-25.
15. Zhu N, Zhang D, Wang W, et al. A novel coronavirus from patients with pneumonia in China, 2019. N Engl J Med 2020; 382:727-33.
16. Jung E, Ro YS, Ryu HH, Shin SD, Moon S. Interaction effects between COVID-19 outbreak and community income levels on excess mortality among patients visiting emergency departments. J Korean Med Sci 2021; 36:e100.
Fig. 1.
Trends associated with emergency department (ED) visits by year, 2018–2022. (A) Age- and sex-standardized ED visits per 100,000 population. (B) Age- and sex-standardized mortality rates. (C) Hospital admission rates. (D) Transfer rates.
Table 1.
Patient demographics, ED visit characteristics, and outcome by KTAS scores
Values are presented as number (%), unless otherwise indicated. Percentages may not total 100 due to rounding.
ED, emergency department; KTAS, Korean Triage and Acuity Scale; SD, standard deviation; IQR, interquartile range.
a) Reporting not obligatory for level III EDs (recording KTAS scores became mandatory starting from 2021). Hence, there is a higher likelihood of missing data.
b) Data for the “other” category are not presented.
c) Proportion among total admissions.
Table 2.
Patient demographics, ED visit characteristics, and outcome by age group
Values are presented as number (%), unless otherwise indicated. Percentages may not total 100 due to rounding.
ED, emergency department; SD, standard deviation; IQR, interquartile range; KTAS, Korean Triage and Acuity Scale.
a) Reporting not obligatory for level III EDs (recording KTAS scores became mandatory starting from 2021). Hence, there is a higher likelihood of missing data.
b) Data for the “other” category are not presented.
c) Proportion among total admissions.
Table 3.
Fifteen most frequently reported chief complaints by UMLS code and primary diagnoses by KCD code (n=9,803,065)
Rank
Chief complaint
Primary diagnosis
UMLS code
No. of patients (%)
KCD code
No. of patients (%)
1
C0000737 (abdominal pain)
708,435 (7.9)
R42 (light headedness)
410,793 (4.2)
2
C0013404 (dyspnea)
654,301 (7.3)
A099 (gastroenteritis and colitis of unspecified origin)
276,299 (2.8)
3
C0012833 (dizziness)
598,055 (6.6)
J189 (pneumonia, unspecified)
261,002 (2.7)
4
C0015967 (fever)
498,130 (5.5)
R1049 (unspecified abdominal pain)
183,187 (1.9)
5
C0004093 (generalized weakness)
370,037 (4.1)
I639 (unspecified cerebral infarction)
144,159 (1.5)
6
C0018681 (headache)
268,212 (3.0)
R060 (shortness of breath)
128,831 (1.3)
7
C0008031 (chest pain)
234,616 (2.6)
R074 (unspecified chest pain)
123,236 (1.3)
8
C0004604 (back pain)
181,981 (2.0)
N390 (urinary tract infection, site not specified)
121,634 (1.3)
9
C0019559 (hip pain)
156,580 (1.7)
R51 (headache)
111,430 (1.1)
10
C0232493 (epigastric pain)
127,502 (1.4)
S0600 (concussion, without open intracranial wound)
107,749 (1.1)
11
C0042963 (vomiting)
100,601 (1.1)
R509 (unspecified fever)
105,160 (1.1)
12
C0235710 (chest discomfort)
95,042 (1.1)
R53 (chronic debility)
103,442 (1.1)
13
C0039070 (syncope)
92,828 (1.0)
K5909 (other and unspecified constipation)
98,206 (1.0)
14
C0011991 (diarrhea)
90,200 (1.0)
U071 (COVID-19, virus identified)
89,099 (0.9)
15
C0024031 (low back pain)
88,983 (1.0)
Z115 (special screening examination for other viral diseases)
80,432 (0.8)
UMLS, Unified Medical Language System; KCD, Korean Classification of Diseases.