Park, Lim, and Ro: Trends in traumatic brain injury–related emergency department visits in Korea: a report from the National Emergency Department Information System (NEDIS) 2018–2022
Trends in traumatic brain injury–related emergency department visits in Korea: a report from the National Emergency Department Information System (NEDIS) 2018–2022
1Department of Emergency Medicine, Hallym University Dongtan Sacred Heart Hospital, Hwaseong, Korea
2National Emergency Medical Center, National Medical Center, Seoul, Korea
3Department of Emergency Medicine, Seoul National University Hospital, Seoul, Korea
Correspondence to: Young Sun Ro Department of Emergency Medicine, Seoul National University Hospital, 103 Daehak-ro, Jongno-gu, Seoul 03080, Korea Email: Ro.youngsun@gmail.com
Received: October 4, 2023 Accepted: October 11, 2023
Traumatic brain injury (TBI) is a major public health problem worldwide. Each year, approximately 27 to 69 million people are diagnosed with TBI worldwide, with an estimated incidence of 351 to 939 cases per 100,000 population [1,2]. Additionally, the age-standardized incidence of TBI in Korea in 2017 was approximately 476 per 100,000 people [3]. According to the most recent report from the Centers for Disease Control and Prevention (CDC) [3], TBI is a leading cause of death and disability, with approximately 210,000 TBI-related hospitalizations in 2020 and 69,000 TBI-related deaths in 2021.
The majority of TBIs is preventable, and TBI is influenced not only by injury-related policies, but also by the environment and societal policies such as those regarding COVID-19 [4,5]. Epidemiological studies on TBI are needed to serve as a basis for targeted prevention and effective treatment of patients with brain injury [6]. Therefore, we aimed to assess the epidemiologic characteristics of patients with TBI presenting to the national emergency department (ED) using the National Emergency Department Information System (NEDIS), specifically to identify changes in the COVID-19 pandemic era. We also investigated population-based TBI incidence and mortality trends to support future injury-related policy establishments.
Ethics statement
This study was approved by the Institutional Review Board of the National Medical Center (No. NMC-2023-08-094). The requirement for informed consent was waived due to the retrospective nature of the study.
DATA SOURCES AND STUDY POPULATION
The study utilized Korea's NEDIS database established in 2003 and managed by the National Emergency Medical Center (NEMC; Seoul, Korea) and the Ministry of Health and Welfare of Korea. NEDIS is a mandatory and comprehensive data collection system from 402 nationwide EDs established in 2020 that includes demographics, symptoms, and prehospital and ED-hospital information. Patient data are automatically transferred to a central server, and coordinators from the NEMC oversee hospital-based monitoring and feedback [7]. In addition, EDs participating in NEDIS are divided into three types based on facilities to provide effective emergency medical services according to injury severity: level I (regional emergency medical centers and regional trauma centers), level II (local emergency medical centers), and level III (local emergency medical agencies) [8].
The eligible population included only patients presenting to the ED due to TBI from January 2018 to December 2022 who arrived within 24 hours of injury and excluded patients who died before arriving to the ED. TBI was defined as any of the diagnostic codes of the International Classification of Diseases, 10th revision (ICD-10), that met the TBI definition by the Korea Disease Control and Prevention Agency (KDCA) and were entered into the NEDIS data (S06.1–S06.9) [9].
CHARACTERISTICS OF TBI-RELATED ED VISITS BY AGE GROUP
From 2018 to 2022, the total number of ED visits within 24 hours due to TBI was 157,864 (Table 1). Overall, the most common method of transportation for visiting the ED was 119 ambulance (60.4%). However, unlike adults, the pediatric group were transported most often by car or walked to the ED (58.7%). In addition, the proportion of ED discharge was high, at 34.6%, in the pediatric group compared to the other groups. In the elderly group, the proportion of death among hospital discharge (11.5%) was highest. Previous reports have also revealed that adults aged 75 years and older have the highest rates of TBI-related ED visits with the highest rates of hospitalization and death [10]. Falls are the leading cause of TBI in older age, and our study demonstrated that the proportion of falls (14.2%), including slips (28.6%), was highest in the elderly group, as in previous results [10,11]. Therefore, considering that the population is gradually aging, policies to reduce falls are needed to prevent TBI. Falls are also a major cause of pediatric TBI. However, because the cause and location of falls vary depending on age, detailed prevention strategies are needed by age [12].
CHARACTERISTICS OF TBI-RELATED ED VISITS BY LEVEL OF ED
Table 2 shows that level I and level II EDs account for 43.2% and 56.7% of all ED visits due to TBI, respectively. However, we evaluated patients with TBI who presented within 24 hours of injury, and it is possible that some level III patients were missed because the time to injury is not a required input for such injury. Nevertheless, considering that most patients with ICD-10 codes from S06.1 to S06.9, excluding those with concussion, are transferred to level I or level II EDs, there appears to be no issue estimating the total patient volume. In both level II and level III EDs, patients transferred from other hospitals accounted for approximately 16%; in level I, the proportion of patients transferred from other hospitals was higher at 28.9%. The median length of ED stay was longest in level I at 201 minutes (interquartile range, 118–360 minutes), and the lower was the ED level, the shorter was the ED stay. Considering that level I has a high hospitalization proportion, especially for intensive care unit admissions, and a high proportion of deaths as a result of final treatment, it can be assumed that level I EDs are treating patients with greater severity. However, as this group accounts for more than 40% of all TBI ED visits, in addition to severity, the high patient volume may also have influenced the length of ED stay [13].
AGE-STANDARDIZED TBI INCIDENCE AND MORTALITY OVER TIME, 2018-2022
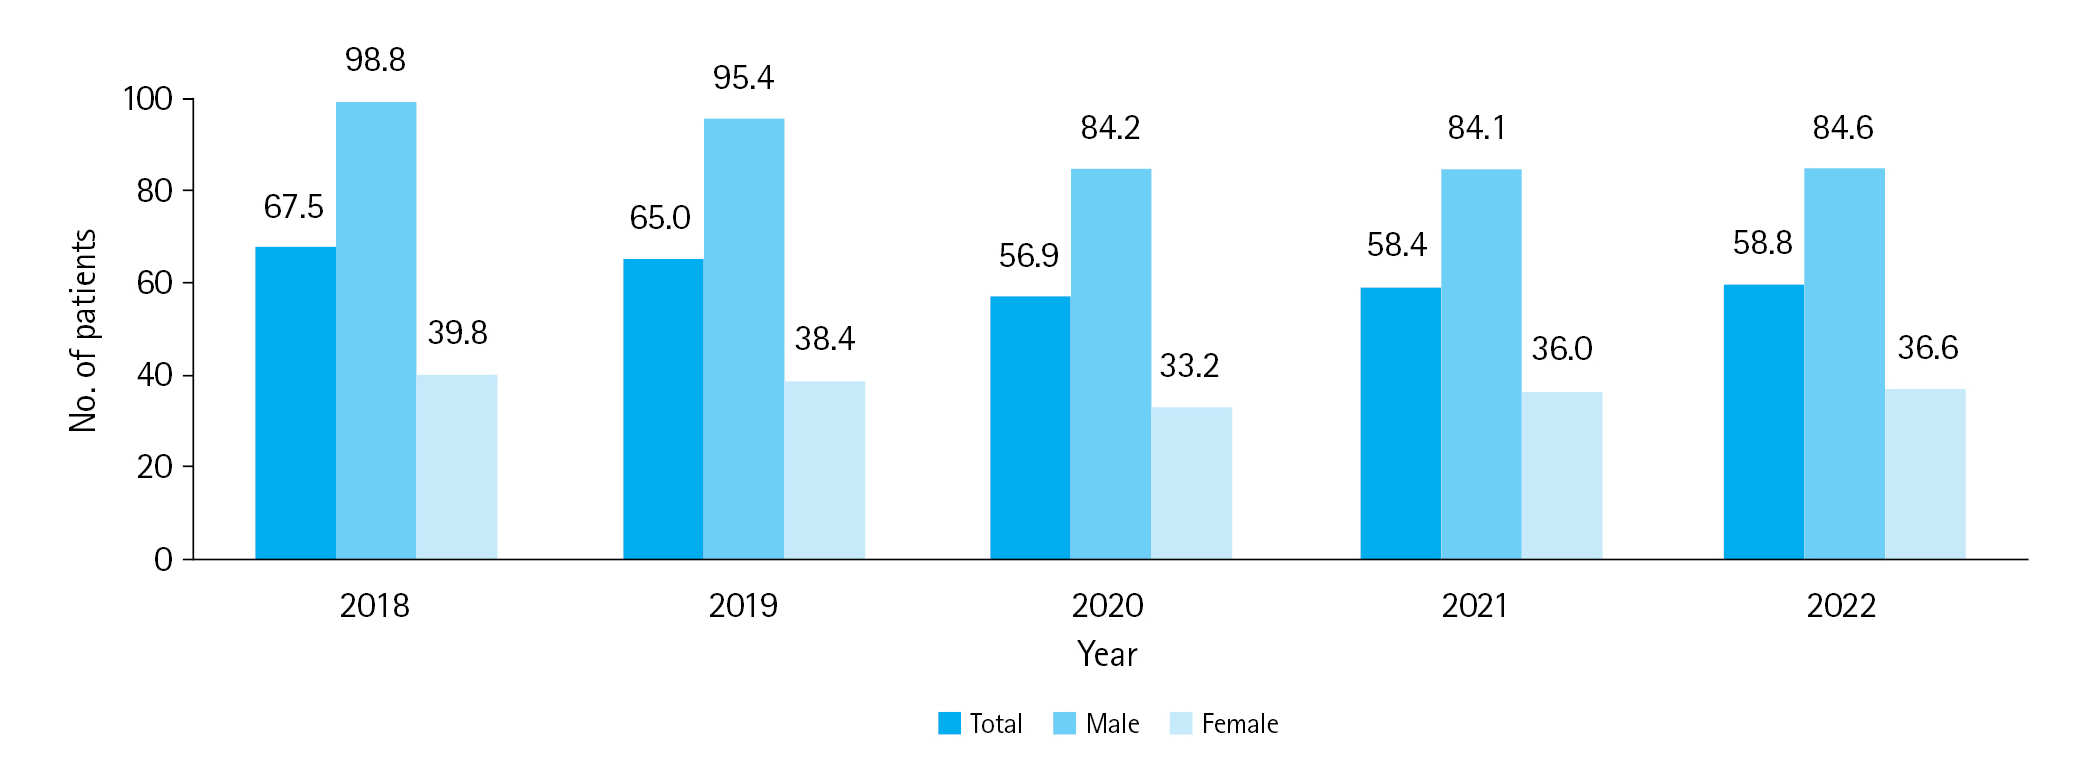
Fig. 1 shows the trends of age- and sex-standardized TBI incidence rate per 100,000 population. Men continue to exhibit higher incidence rates of TBI compared to women, and previous studies have shown that men are nearly twice as likely to be hospitalized and three times more likely to die from a TBI than women [3]. Moreover, the incidence of TBIs revealed a decreasing trend. In particular, during the COVID-19 period, the incidence rate decreased from 67.5 in 2018 to 56.9 in 2020. The main basis for these results is believed to be the reduction in traffic accidents, which are thought to be the main cause of TBIs, due to lockdowns and work-from-home strategies during the pandemic [14–17]. However, the in-hospital mortality rate tended to increase from 9.3% in 2018 to 10.1% in 2022 (Fig. 2). Similarly, the age- and sex-standardized mortality rate of TBIs per 100,000 ED visits increased from 36.0 in 2018 to 39.1 in 2022 (Fig. 3). The differences in incidence and mortality trends may be due to increased rates of fatal TBIs, such as falls, especially in older age groups [9,18]. Furthermore, mortality trends appear to differ by sex, suggesting priority areas for TBI-related prevention.
This analysis highlights the high proportion of fatal TBIs in the elderly adult group, with falls being the leading cause in all age groups. Additional research is needed to determine whether changes in TBI incidence and mortality rates observed during the COVID-19 period are due to environmental and policy influences.
NOTES
Author contributions
Conceptualization: all authors; Data curation: BL, YSR; Methodology: all authors; Project administration: YSR; Visualization: HAP, BL; Writing–original draft: HAP; Writing–review & editing: all authors. All authors read and approved the final manuscript.
Conflicts of interest
The authors have no conflicts of interest to declare.
Funding
The authors recieved no financial support for this study.
Data availability
Data of this study are from the National Emergency Medical Center (NEMC; Seoul, Korea) under the Ministry of Health and Welfare of Korea, which were used under license for the current study. Although the data are not publicly accessible, they are available from the corresponding author upon reasonable request with permission from the NEMC.
REFERENCES
1. Dewan MC, Rattani A, Gupta S, et al. Estimating the global incidence of traumatic brain injury. J Neurosurg 2018; 130:1080-97.
2. GBD 2016 Traumatic Brain Injury and Spinal Cord Injury Collaborators. Global, regional, and national burden of traumatic brain injury and spinal cord injury, 1990-2016: a systematic analysis for the Global Burden of Disease Study 2016. Lancet Neurol 2019; 18:56-87.
4. Peeters W, van den Brande R, Polinder S, et al. Epidemiology of traumatic brain injury in Europe. Acta Neurochir (Wien) 2015; 157:1683-96.
5. Cho YS, Ro YS, Park JH, Moon S. Effect of social distancing on injury incidence during the COVID-19 pandemic: an interrupted time-series analysis. BMJ Open 2022; 12:e055296.
6. Boswell JE, McErlean M, Verdile VP. Prevalence of traumatic brain injury in an ED population. Am J Emerg Med 2002; 20:177-80.
7. Pak YS, Ro YS, Kim SH, et al. Effects of emergency care-related health policies during the COVID-19 pandemic in Korea: a quasi-experimental study. J Korean Med Sci 2021; 36:e121.
8. Kim YJ, Hong JS, Hong SI, et al. The prevalence and emergency department utilization of patients who underwent single and double inter-hospital transfers in the emergency department: a nationwide population-based study in Korea, 2016-2018. J Korean Med Sci 2021; 36:e172.
9. Bae S, Song SW, Kim WJ, et al. Traumatic brain injury in patients aged ≥65 years versus patients aged ≥80 years: a multicenter prospective study of mortality and medical resource utilization. Clin Exp Emerg Med 2021; 8:94-102.
10. Taylor CA, Bell JM, Breiding MJ, Xu L. Traumatic brain injury-related emergency department visits, hospitalizations, and deaths: United States, 2007 and 2013. MMWR Surveill Summ 2017; 66:1-16.
11. Huh KR, Kim JY, Choi SH, Yoon YH, Park SJ, Lee ES. Comparison of traumatic brain injury patients with brain computed tomography in the emergency department by age group. Clin Exp Emerg Med 2020; 7:81-6.
12. Na WI, Park JO, Cho GC, Lee EJ, Wang SJ, Park HA. Risk factors for intracranial injury caused by falls at home in Korea using data from the Emergency Department-based Injury In-depth Surveillance (2011-2018). J Korean Med Sci 2021; 36:e53.
13. Lee HJ, Ju YJ, Park EC. Positive correlation between regional emergency medical resources and mortality in severely injured patients: results from the Korean National Hospital Discharge In-depth Survey. CJEM 2017; 19:450-8.
14. Figueroa JM, Boddu J, Kader M, et al. The effects of lockdown during the severe acute respiratory syndrome coronavirus 2 (SARS-CoV-2) pandemic on neurotrauma-related hospital admissions. World Neurosurg 2021; 146:e1-5.
15. Ozoner B, Gungor A, Hasanov T, Toktas ZO, Kilic T. Neurosurgical practice during coronavirus disease 2019 (COVID-19) pandemic. World Neurosurg 2020; 140:198-207.
16. Katrakazas C, Michelaraki E, Sekadakis M, Yannis G. A descriptive analysis of the effect of the COVID-19 pandemic on driving behavior and road safety. Transp Res Interdiscip Perspect 2020; 7:100186.
17. Grassner L, Petr O, Warner FM, et al. Trends and outcomes for non-elective neurosurgical procedures in Central Europe during the COVID-19 pandemic. Sci Rep 2021; 11:6171.
18. Thompson HJ, McCormick WC, Kagan SH. Traumatic brain injury in older adults: epidemiology, outcomes, and future implications. J Am Geriatr Soc 2006; 54:1590-5.
Fig. 1.
Age- and sex-adjusted emergency department visits due to traumatic brain injury per 100,000 population in Korea.
Fig. 2.
In-hospital mortality rate of traumatic brain injury in Korea.
Fig. 3.
Age and sex-adjusted mortality per 100,000 emergency department visits due to traumatic brain injury in Korea.
Table 1.
Characteristics of traumatic brain injury–related ED visits by age group in Korea (2018–2022)